S 8VCPU 16GB INTEL by DigitalOcean
Geekbench is a cross-platform processor benchmark with a scoring system that determines single-core and multi-core performance using loads simulating real-world scenarios. Geekbench 5 score is calculated with a reference score of 2500 representing the performance of the Intel Core i5-2520M @ 2.50 GHz. The software benchmark is available for Mac OS, Windows, Linux, Android and iOS platforms.
Specifications:
CPU
8
RAM
16.0 GB
Root
320 GB
Root SSD
{
"configuration": {
"chart": {
"type": "scatter",
"polar": false,
"zoomType": "",
"options3d": {},
"height": null,
"width": null,
"margin": null,
"inverted": false,
"zooming": {}
},
"credits": {
"enabled": false
},
"title": {
"text": ""
},
"colorAxis": null,
"subtitle": {
"text": ""
},
"xAxis": {
"title": {
"text": [
"Single Score"
],
"useHTML": false,
"style": {
"color": "#666666"
}
},
"categories": null,
"lineWidth": 1,
"tickInterval": null,
"tickWidth": 1,
"tickLength": 10,
"tickPixelInterval": 100,
"plotLines": null,
"labels": {
"enabled": true,
"format": null,
"formatter": "",
"style": {
"color": "#666666",
"cursor": "default",
"fontSize": "11px"
},
"useHTML": false,
"step": 0
},
"plotBands": null,
"visible": true,
"floor": null,
"ceiling": null,
"type": "linear",
"min": 0,
"gridLineWidth": 1,
"gridLineColor": "#e6e6e6",
"minorTickInterval": null,
"minorTickWidth": 0,
"minTickInterval": null,
"startOnTick": true,
"endOnTick": true,
"tickmarkPlacement": 100,
"units": 100,
"minRange": 100
},
"yAxis": {
"title": {
"text": [
"Multi Score"
],
"useHTML": false,
"style": {
"color": "#666666"
}
},
"categories": null,
"plotLines": null,
"plotBands": null,
"lineWidth": null,
"tickInterval": null,
"tickLength": 10,
"floor": null,
"ceiling": null,
"gridLineInterpolation": null,
"gridLineWidth": 1,
"gridLineColor": "#e6e6e6",
"min": 0,
"max": null,
"minorTickInterval": null,
"minorTickWidth": 0,
"minTickInterval": null,
"startOnTick": true,
"endOnTick": true,
"minRange": null,
"type": "linear",
"tickmarkPlacement": null,
"labels": {
"enabled": true,
"formatter": null,
"style": {
"color": "#666666",
"cursor": "default",
"fontSize": "11px"
},
"useHTML": false
}
},
"zAxis": {
"title": {
"text": "Multi Score"
}
},
"plotOptions": {
"series": {
"dataLabels": {
"enabled": false,
"format": null,
"distance": 30,
"align": "center",
"inside": null,
"allowOverlap": false,
"style": {
"fontSize": "11px"
}
},
"showInLegend": null,
"turboThreshold": 0,
"stacking": "",
"groupPadding": 0.2,
"centerInCategory": false,
"findNearestPointBy": "x"
}
},
"navigator": {
"enabled": false
},
"scrollbar": {
"enabled": false
},
"rangeSelector": {
"enabled": false,
"inputEnabled": false
},
"legend": {
"enabled": null,
"maxHeight": null,
"align": "center",
"verticalAlign": "bottom",
"layout": "horizontal",
"width": null,
"margin": 12,
"reversed": false
},
"series": [
{
"name": "S 8VCPU 16GB INTEL by DigitalOcean",
"color": "#057fff",
"data": [
{
"x": 677.2250363850117,
"y": 3415.560730194329
},
{
"x": 453.59067496773355,
"y": 2970.8095307552035
},
{
"x": 642.2674078632149,
"y": 3393.6090599236722
},
{
"x": 445.30406433690257,
"y": 2956.6526398822425
},
{
"x": 651.3063727480223,
"y": 3476.1283584469948
},
{
"x": 445.8839499696744,
"y": 2931.591045407673
},
{
"x": 684.6962875187955,
"y": 3447.853160025722
},
{
"x": 438.4446861794436,
"y": 2962.462031650598
},
{
"x": 661.538537879772,
"y": 3304.207618745293
},
{
"x": 671.6836339040267,
"y": 3380.83881875537
},
{
"x": 429.81144770779383,
"y": 2930.585665526123
},
{
"x": 625.0956047416488,
"y": 3145.693805636135
},
{
"x": 477.6750804329779,
"y": 2869.3571026107893
},
{
"x": 636.504281618378,
"y": 3490.4159050929343
},
{
"x": 491.266167205162,
"y": 2863.7264147552746
},
{
"x": 663.8302900667022,
"y": 3428.599411416832
},
{
"x": 442.7635142046048,
"y": 2950.789918218751
},
{
"x": 636.6592126105918,
"y": 3399.4053055046897
},
{
"x": 439.51201534846575,
"y": 2876.3505526712242
},
{
"x": 465.7035748044987,
"y": 2904.2451643960994
},
{
"x": 788.5708061227847,
"y": 4398.50940470359
},
{
"x": 619.8976084964205,
"y": 3606.508974979554
},
{
"x": 711.6147086372953,
"y": 4349.2974625822435
},
{
"x": 608.9241594016972,
"y": 3682.0812166169317
},
{
"x": 696.7956159656109,
"y": 4146.997242065263
},
{
"x": 622.7800794674725,
"y": 3779.090408212037
},
{
"x": 783.1409832421152,
"y": 5201.915800561758
},
{
"x": 808.4834073869134,
"y": 5177.146134216142
},
{
"x": 782.3550782778918,
"y": 5389.474922480311
},
{
"x": 799.6152725590706,
"y": 5102.289998149112
},
{
"x": 782.5275244371362,
"y": 5489.959725958332
},
{
"x": 806.9903483984051,
"y": 5204.236237467905
}
]
}
],
"drilldown": {},
"tooltip": {
"enabled": true,
"useHTML": false,
"format": null,
"headerFormat": "",
"pointFormat": "<span style=\"color:{series.color}\">Single</span>: <b>{point.x:.0f}</b><br><span style=\"color:{series.color}\">Multi</span>: <b>{point.y:.0f}</b>",
"footerFormat": "",
"shared": false,
"outside": false,
"valueDecimals": null,
"split": false
},
"annotations": null
},
"hc_type": "chart",
"id": "81894370463370914247595844561417375432"
}
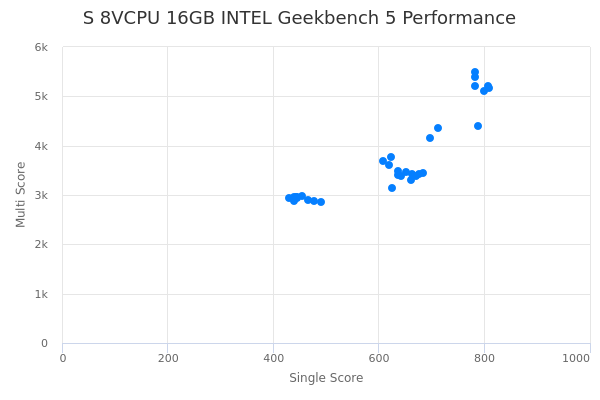
| Single | Multi | |
|---|---|---|
| Max | 808 | 5490 |
| Average | 622 | 3707 |
| Deviation | 127.84 | 847.48 |
| Min | 430 | 2864 |
Sign up as Freemium to get more insight.
- In same series
- S 1VCPU 1GB 35GB INTEL
- S 1VCPU 1GB INTEL
- S 1VCPU 2GB 70GB INTEL
- S 1VCPU 2GB INTEL
- S 2VCPU 2GB 90GB INTEL
- S 2VCPU 2GB INTEL
- S 2VCPU 4GB 120GB INTEL
- S 2VCPU 4GB INTEL
- S 2VCPU 8GB 160GB INTEL
- S 4VCPU 8GB 240GB INTEL
- S 4VCPU 8GB INTEL
- S 4VCPU 16GB 320GB INTEL
- S 8VCPU 16GB 480GB INTEL
- S 8VCPU 16GB INTEL
- S 8VCPU 32GB 640GB INTEL
- S 16VCPU 64GB INTEL