M3 2VCPU 16GB by DigitalOcean
Geekbench is a cross-platform processor benchmark with a scoring system that determines single-core and multi-core performance using loads simulating real-world scenarios. Geekbench 5 score is calculated with a reference score of 2500 representing the performance of the Intel Core i5-2520M @ 2.50 GHz. The software benchmark is available for Mac OS, Windows, Linux, Android and iOS platforms.
Specifications:
CPU
2
RAM
16.0 GB
Root
150 GB
Root SSD
{
"configuration": {
"chart": {
"type": "scatter",
"polar": false,
"zoomType": "",
"options3d": {},
"height": null,
"width": null,
"margin": null,
"inverted": false,
"zooming": {}
},
"credits": {
"enabled": false
},
"title": {
"text": ""
},
"colorAxis": null,
"subtitle": {
"text": ""
},
"xAxis": {
"title": {
"text": [
"Single Score"
],
"useHTML": false,
"style": {
"color": "#666666"
}
},
"categories": null,
"lineWidth": 1,
"tickInterval": null,
"tickWidth": 1,
"tickLength": 10,
"tickPixelInterval": 100,
"plotLines": null,
"labels": {
"enabled": true,
"format": null,
"formatter": "",
"style": {
"color": "#666666",
"cursor": "default",
"fontSize": "11px"
},
"useHTML": false,
"step": 0
},
"plotBands": null,
"visible": true,
"floor": null,
"ceiling": null,
"type": "linear",
"min": 0,
"gridLineWidth": 1,
"gridLineColor": "#e6e6e6",
"minorTickInterval": null,
"minorTickWidth": 0,
"minTickInterval": null,
"startOnTick": true,
"endOnTick": true,
"tickmarkPlacement": 100,
"units": 100,
"minRange": 100
},
"yAxis": {
"title": {
"text": [
"Multi Score"
],
"useHTML": false,
"style": {
"color": "#666666"
}
},
"categories": null,
"plotLines": null,
"plotBands": null,
"lineWidth": null,
"tickInterval": null,
"tickLength": 10,
"floor": null,
"ceiling": null,
"gridLineInterpolation": null,
"gridLineWidth": 1,
"gridLineColor": "#e6e6e6",
"min": 0,
"max": null,
"minorTickInterval": null,
"minorTickWidth": 0,
"minTickInterval": null,
"startOnTick": true,
"endOnTick": true,
"minRange": null,
"type": "linear",
"tickmarkPlacement": null,
"labels": {
"enabled": true,
"formatter": null,
"style": {
"color": "#666666",
"cursor": "default",
"fontSize": "11px"
},
"useHTML": false
}
},
"zAxis": {
"title": {
"text": "Multi Score"
}
},
"plotOptions": {
"series": {
"dataLabels": {
"enabled": false,
"format": null,
"distance": 30,
"align": "center",
"inside": null,
"allowOverlap": false,
"style": {
"fontSize": "11px"
}
},
"showInLegend": null,
"turboThreshold": 0,
"stacking": "",
"groupPadding": 0.2,
"centerInCategory": false,
"findNearestPointBy": "x"
}
},
"navigator": {
"enabled": false
},
"scrollbar": {
"enabled": false
},
"rangeSelector": {
"enabled": false,
"inputEnabled": false
},
"legend": {
"enabled": null,
"maxHeight": null,
"align": "center",
"verticalAlign": "bottom",
"layout": "horizontal",
"width": null,
"margin": 12,
"reversed": false
},
"series": [
{
"name": "M3 2VCPU 16GB by DigitalOcean",
"color": "#057fff",
"data": [
{
"x": 886.2437847006058,
"y": 1083.642473398974
},
{
"x": 883.8573748960384,
"y": 1079.9053023518493
},
{
"x": 898.0518562945401,
"y": 1094.2433967234274
},
{
"x": 895.4896246380374,
"y": 1092.6173279605348
},
{
"x": 898.1722823543374,
"y": 1086.4499200198684
},
{
"x": 897.1609849615335,
"y": 1086.7160748602453
},
{
"x": 895.5960758879053,
"y": 1088.6655875058373
},
{
"x": 895.080311122301,
"y": 1084.9510758770223
},
{
"x": 897.2243291226437,
"y": 1092.009087181398
},
{
"x": 897.1115241479722,
"y": 1089.3663804987607
},
{
"x": 907.5931422566173,
"y": 1099.9103673761051
},
{
"x": 890.3896646897342,
"y": 1086.639957413653
},
{
"x": 906.7154723875165,
"y": 1094.0049648460097
},
{
"x": 890.5282333339899,
"y": 1088.7822040712424
},
{
"x": 898.4506510004252,
"y": 1090.173164378426
},
{
"x": 892.7352803030631,
"y": 1089.8123172866556
},
{
"x": 900.0236464729214,
"y": 1086.3842942587098
},
{
"x": 885.2244984984286,
"y": 1087.2348462248242
},
{
"x": 901.2106334966379,
"y": 1094.666727331507
},
{
"x": 902.4496382694078,
"y": 1089.525857879648
}
]
}
],
"drilldown": {},
"tooltip": {
"enabled": true,
"useHTML": false,
"format": null,
"headerFormat": "",
"pointFormat": "<span style=\"color:{series.color}\">Single</span>: <b>{point.x:.0f}</b><br><span style=\"color:{series.color}\">Multi</span>: <b>{point.y:.0f}</b>",
"footerFormat": "",
"shared": false,
"outside": false,
"valueDecimals": null,
"split": false
},
"annotations": null
},
"hc_type": "chart",
"id": "228496088016505682886600755780083686193"
}
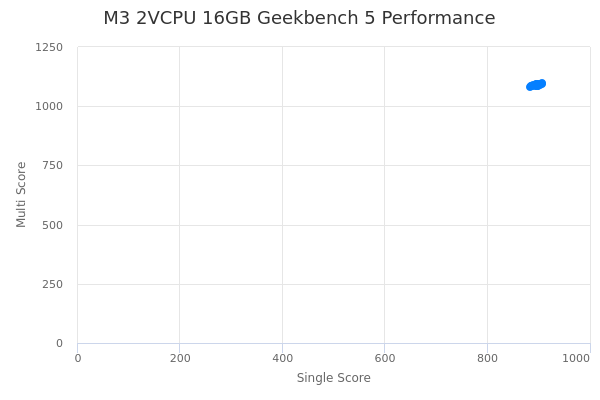
| Single | Multi | |
|---|---|---|
| Max | 908 | 1100 |
| Average | 896 | 1089 |
| Deviation | 6.27 | 4.37 |
| Min | 884 | 1080 |
Sign up as Freemium to get more insight.