M 4VCPU 32GB by DigitalOcean
Geekbench is a cross-platform processor benchmark with a scoring system that determines single-core and multi-core performance using loads simulating real-world scenarios. Geekbench 5 score is calculated with a reference score of 2500 representing the performance of the Intel Core i5-2520M @ 2.50 GHz. The software benchmark is available for Mac OS, Windows, Linux, Android and iOS platforms.
Specifications:
CPU
4
RAM
32.0 GB
Root
100 GB
Root SSD
{
"configuration": {
"chart": {
"type": "scatter",
"polar": false,
"zoomType": "",
"options3d": {},
"height": null,
"width": null,
"margin": null,
"inverted": false,
"zooming": {}
},
"credits": {
"enabled": false
},
"title": {
"text": ""
},
"colorAxis": null,
"subtitle": {
"text": ""
},
"xAxis": {
"title": {
"text": [
"Single Score"
],
"useHTML": false,
"style": {
"color": "#666666"
}
},
"categories": null,
"lineWidth": 1,
"tickInterval": null,
"tickWidth": 1,
"tickLength": 10,
"tickPixelInterval": 100,
"plotLines": null,
"labels": {
"enabled": true,
"format": null,
"formatter": "",
"style": {
"color": "#666666",
"cursor": "default",
"fontSize": "11px"
},
"useHTML": false,
"step": 0
},
"plotBands": null,
"visible": true,
"floor": null,
"ceiling": null,
"type": "linear",
"min": 0,
"gridLineWidth": 1,
"gridLineColor": "#e6e6e6",
"minorTickInterval": null,
"minorTickWidth": 0,
"minTickInterval": null,
"startOnTick": true,
"endOnTick": true,
"tickmarkPlacement": 100,
"units": 100,
"minRange": 100
},
"yAxis": {
"title": {
"text": [
"Multi Score"
],
"useHTML": false,
"style": {
"color": "#666666"
}
},
"categories": null,
"plotLines": null,
"plotBands": null,
"lineWidth": null,
"tickInterval": null,
"tickLength": 10,
"floor": null,
"ceiling": null,
"gridLineInterpolation": null,
"gridLineWidth": 1,
"gridLineColor": "#e6e6e6",
"min": 0,
"max": null,
"minorTickInterval": null,
"minorTickWidth": 0,
"minTickInterval": null,
"startOnTick": true,
"endOnTick": true,
"minRange": null,
"type": "linear",
"tickmarkPlacement": null,
"labels": {
"enabled": true,
"formatter": null,
"style": {
"color": "#666666",
"cursor": "default",
"fontSize": "11px"
},
"useHTML": false
}
},
"zAxis": {
"title": {
"text": "Multi Score"
}
},
"plotOptions": {
"series": {
"dataLabels": {
"enabled": false,
"format": null,
"distance": 30,
"align": "center",
"inside": null,
"allowOverlap": false,
"style": {
"fontSize": "11px"
}
},
"showInLegend": null,
"turboThreshold": 0,
"stacking": "",
"groupPadding": 0.2,
"centerInCategory": false,
"findNearestPointBy": "x"
}
},
"navigator": {
"enabled": false
},
"scrollbar": {
"enabled": false
},
"rangeSelector": {
"enabled": false,
"inputEnabled": false
},
"legend": {
"enabled": null,
"maxHeight": null,
"align": "center",
"verticalAlign": "bottom",
"layout": "horizontal",
"width": null,
"margin": 12,
"reversed": false
},
"series": [
{
"name": "M 4VCPU 32GB by DigitalOcean",
"color": "#057fff",
"data": [
{
"x": 888.5099200721154,
"y": 2048.6741378954266
},
{
"x": 886.490135579298,
"y": 2044.0662018340468
},
{
"x": 872.4907186045309,
"y": 2083.713407875771
},
{
"x": 873.1892455912556,
"y": 2084.2014137078613
},
{
"x": 870.6328684020202,
"y": 2115.5353158074377
},
{
"x": 875.7772811308012,
"y": 2112.294413069468
},
{
"x": 873.5449656620749,
"y": 2099.868100991639
},
{
"x": 870.7655774235507,
"y": 2106.115153879514
},
{
"x": 876.7242381357264,
"y": 2110.1981023912085
},
{
"x": 879.8187637180238,
"y": 2115.8680431215116
},
{
"x": 958.2484247327122,
"y": 2287.084498764192
},
{
"x": 908.2701981222881,
"y": 2166.093246269371
},
{
"x": 950.2551696736141,
"y": 2254.9840759124454
},
{
"x": 908.34624072581,
"y": 2169.143408713968
},
{
"x": 962.8495430923975,
"y": 2289.46088207853
},
{
"x": 904.0790706803182,
"y": 2190.5629792914174
},
{
"x": 958.8483325722959,
"y": 2256.036982272384
},
{
"x": 920.362759241916,
"y": 2200.624968537175
},
{
"x": 934.2721016110877,
"y": 2222.4287314960984
},
{
"x": 910.784968178458,
"y": 2152.586003517561
},
{
"x": 944.3664718607879,
"y": 2268.550032327263
},
{
"x": 908.7534942893863,
"y": 2184.1125299209484
},
{
"x": 930.4886306592637,
"y": 2223.4770362281097
},
{
"x": 914.4378999646939,
"y": 2189.547931840524
},
{
"x": 933.3208166598254,
"y": 2266.3270838485923
},
{
"x": 920.9883477051856,
"y": 2187.716089673361
},
{
"x": 956.8546343911191,
"y": 2292.973700862236
},
{
"x": 919.6937426293251,
"y": 2185.5012206844062
},
{
"x": 954.3349930763522,
"y": 2232.302994484731
},
{
"x": 910.5238765850704,
"y": 2196.966897624278
}
]
}
],
"drilldown": {},
"tooltip": {
"enabled": true,
"useHTML": false,
"format": null,
"headerFormat": "",
"pointFormat": "<span style=\"color:{series.color}\">Single</span>: <b>{point.x:.0f}</b><br><span style=\"color:{series.color}\">Multi</span>: <b>{point.y:.0f}</b>",
"footerFormat": "",
"shared": false,
"outside": false,
"valueDecimals": null,
"split": false
},
"annotations": null
},
"hc_type": "chart",
"id": "103251388877205759867077127474820880010"
}
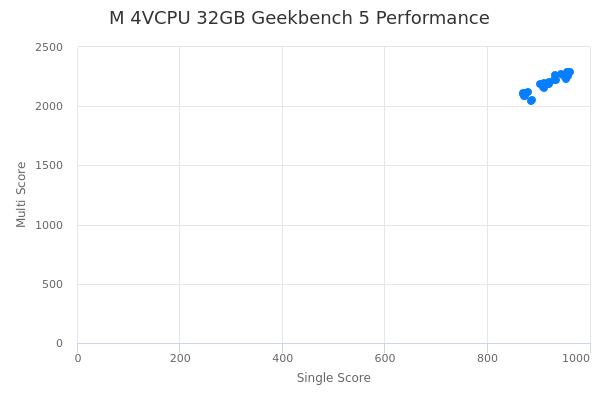
| Single | Multi | |
|---|---|---|
| Max | 963 | 2293 |
| Average | 913 | 2178 |
| Deviation | 30.33 | 71.90 |
| Min | 871 | 2044 |
Sign up as Freemium to get more insight.