1GB by DigitalOcean
Geekbench is a cross-platform processor benchmark with a scoring system that determines single-core and multi-core performance using loads simulating real-world scenarios. Geekbench 5 score is calculated with a reference score of 2500 representing the performance of the Intel Core i5-2520M @ 2.50 GHz. The software benchmark is available for Mac OS, Windows, Linux, Android and iOS platforms.
Specifications:
CPU
1
RAM
1.0 GB
Root
30 GB
Root SSD
{
"configuration": {
"chart": {
"type": "scatter",
"polar": false,
"zoomType": "",
"options3d": {},
"height": null,
"width": null,
"margin": null,
"inverted": false,
"zooming": {}
},
"credits": {
"enabled": false
},
"title": {
"text": ""
},
"colorAxis": null,
"subtitle": {
"text": ""
},
"xAxis": {
"title": {
"text": [
"Single Score"
],
"useHTML": false,
"style": {
"color": "#666666"
}
},
"categories": null,
"lineWidth": 1,
"tickInterval": null,
"tickWidth": 1,
"tickLength": 10,
"tickPixelInterval": 100,
"plotLines": null,
"labels": {
"enabled": true,
"format": null,
"formatter": "",
"style": {
"color": "#666666",
"cursor": "default",
"fontSize": "11px"
},
"useHTML": false,
"step": 0
},
"plotBands": null,
"visible": true,
"floor": null,
"ceiling": null,
"type": "linear",
"min": 0,
"gridLineWidth": 1,
"gridLineColor": "#e6e6e6",
"minorTickInterval": null,
"minorTickWidth": 0,
"minTickInterval": null,
"startOnTick": true,
"endOnTick": true,
"tickmarkPlacement": 100,
"units": 100,
"minRange": 100
},
"yAxis": {
"title": {
"text": [
"Multi Score"
],
"useHTML": false,
"style": {
"color": "#666666"
}
},
"categories": null,
"plotLines": null,
"plotBands": null,
"lineWidth": null,
"tickInterval": null,
"tickLength": 10,
"floor": null,
"ceiling": null,
"gridLineInterpolation": null,
"gridLineWidth": 1,
"gridLineColor": "#e6e6e6",
"min": 0,
"max": null,
"minorTickInterval": null,
"minorTickWidth": 0,
"minTickInterval": null,
"startOnTick": true,
"endOnTick": true,
"minRange": null,
"type": "linear",
"tickmarkPlacement": null,
"labels": {
"enabled": true,
"formatter": null,
"style": {
"color": "#666666",
"cursor": "default",
"fontSize": "11px"
},
"useHTML": false
}
},
"zAxis": {
"title": {
"text": "Multi Score"
}
},
"plotOptions": {
"series": {
"dataLabels": {
"enabled": false,
"format": null,
"distance": 30,
"align": "center",
"inside": null,
"allowOverlap": false,
"style": {
"fontSize": "11px"
}
},
"showInLegend": null,
"turboThreshold": 0,
"stacking": "",
"groupPadding": 0.2,
"centerInCategory": false,
"findNearestPointBy": "x"
}
},
"navigator": {
"enabled": false
},
"scrollbar": {
"enabled": false
},
"rangeSelector": {
"enabled": false,
"inputEnabled": false
},
"legend": {
"enabled": null,
"maxHeight": null,
"align": "center",
"verticalAlign": "bottom",
"layout": "horizontal",
"width": null,
"margin": 12,
"reversed": false
},
"series": [
{
"name": "1GB by DigitalOcean",
"color": "#057fff",
"data": [
{
"x": 768.5958819311461,
"y": 773.0343224929865
},
{
"x": 694.756896433666,
"y": 660.182285823831
},
{
"x": 783.6503802050681,
"y": 776.6853222761725
},
{
"x": 682.1487189994286,
"y": 702.5191800685132
},
{
"x": 802.2297678642373,
"y": 788.760211411817
},
{
"x": 709.1227312682817,
"y": 705.4182547481365
},
{
"x": 797.1781192319045,
"y": 807.0971751173207
},
{
"x": 721.8212801843656,
"y": 680.1416643842953
},
{
"x": 788.9711732051547,
"y": 790.8069741835675
},
{
"x": 672.3607451078227,
"y": 695.397070994742
},
{
"x": 664.0149161374267,
"y": 654.3995476808569
},
{
"x": 416.94967127088114,
"y": 430.6169189122837
},
{
"x": 631.6462409614348,
"y": 654.6150987143867
},
{
"x": 427.48307974077306,
"y": 435.6516173048762
},
{
"x": 673.7642343877859,
"y": 661.2542135793649
},
{
"x": 433.69496738176883,
"y": 391.59335711896404
},
{
"x": 697.0676060195392,
"y": 669.7391370206128
},
{
"x": 651.0940838471378,
"y": 641.2571404897645
},
{
"x": 422.1207816664626,
"y": 443.3065457730346
},
{
"x": 455.43934766089086,
"y": 447.17065412832267
},
{
"x": 663.5286475856806,
"y": 655.8151949410733
},
{
"x": 461.4287175831773,
"y": 489.7792945072455
},
{
"x": 703.14248644746,
"y": 711.518090517986
},
{
"x": 469.2597025460338,
"y": 443.3167501967479
},
{
"x": 699.5829498174709,
"y": 703.4087433796675
},
{
"x": 482.10475126461404,
"y": 478.83118508721043
},
{
"x": 708.619283766951,
"y": 701.533914591252
},
{
"x": 689.5944088571885,
"y": 688.2531853878157
},
{
"x": 474.47329087559103,
"y": 486.97447100580416
},
{
"x": 490.1553012607059,
"y": 466.57732484054
}
]
}
],
"drilldown": {},
"tooltip": {
"enabled": true,
"useHTML": false,
"format": null,
"headerFormat": "",
"pointFormat": "<span style=\"color:{series.color}\">Single</span>: <b>{point.x:.0f}</b><br><span style=\"color:{series.color}\">Multi</span>: <b>{point.y:.0f}</b>",
"footerFormat": "",
"shared": false,
"outside": false,
"valueDecimals": null,
"split": false
},
"annotations": null
},
"hc_type": "chart",
"id": "67879490365627712946463755736883513497"
}
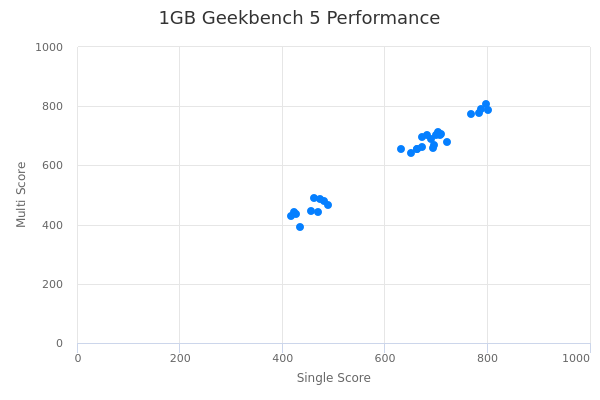
| Single | Multi | |
|---|---|---|
| Max | 802 | 807 |
| Average | 625 | 621 |
| Deviation | 128.55 | 128.19 |
| Min | 417 | 392 |
Sign up as Freemium to get more insight.
- In same series
- 512MB
- 1GB
- 2GB
- 4GB
- 8GB
- C2 4VPCU 8GB
- 16GB
- C2 8VPCU 16GB
- 32GB
- 48GB
- 64GB
- C2 32VPCU 64GB