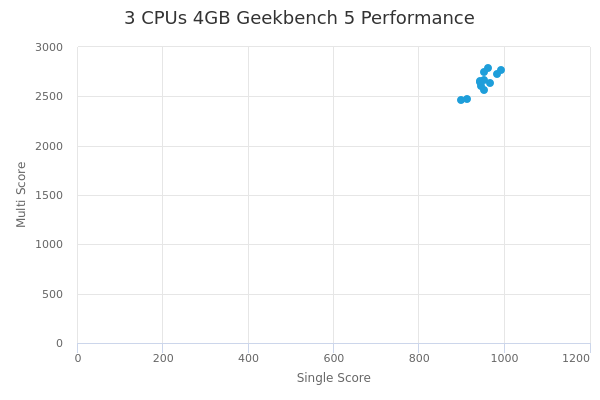
3 CPUs 4GB by Denv-R
Geekbench is a cross-platform processor benchmark with a scoring system that determines single-core and multi-core performance using loads simulating real-world scenarios. Geekbench 5 score is calculated with a reference score of 2500 representing the performance of the Intel Core i5-2520M @ 2.50 GHz. The software benchmark is available for Mac OS, Windows, Linux, Android and iOS platforms.
Specifications:
CPU
3
RAM
4.0 GB
Net
10000 Mbps
{
"configuration": {
"chart": {
"type": "scatter",
"polar": false,
"zoomType": "",
"options3d": {},
"height": null,
"width": null,
"margin": null,
"inverted": false,
"zooming": {}
},
"credits": {
"enabled": false
},
"title": {
"text": ""
},
"colorAxis": null,
"subtitle": {
"text": ""
},
"xAxis": {
"title": {
"text": [
"Single Score"
],
"useHTML": false,
"style": {
"color": "#666666"
}
},
"categories": null,
"lineWidth": 1,
"tickInterval": null,
"tickWidth": 1,
"tickLength": 10,
"tickPixelInterval": 100,
"plotLines": null,
"labels": {
"enabled": true,
"format": null,
"formatter": "",
"style": {
"color": "#666666",
"cursor": "default",
"fontSize": "11px"
},
"useHTML": false,
"step": 0
},
"plotBands": null,
"visible": true,
"floor": null,
"ceiling": null,
"type": "linear",
"min": 0,
"gridLineWidth": 1,
"gridLineColor": "#e6e6e6",
"minorTickInterval": null,
"minorTickWidth": 0,
"minTickInterval": null,
"startOnTick": true,
"endOnTick": true,
"tickmarkPlacement": 100,
"units": 100,
"minRange": 100
},
"yAxis": {
"title": {
"text": [
"Multi Score"
],
"useHTML": false,
"style": {
"color": "#666666"
}
},
"categories": null,
"plotLines": null,
"plotBands": null,
"lineWidth": null,
"tickInterval": null,
"tickLength": 10,
"floor": null,
"ceiling": null,
"gridLineInterpolation": null,
"gridLineWidth": 1,
"gridLineColor": "#e6e6e6",
"min": 0,
"max": null,
"minorTickInterval": null,
"minorTickWidth": 0,
"minTickInterval": null,
"startOnTick": true,
"endOnTick": true,
"minRange": null,
"type": "linear",
"tickmarkPlacement": null,
"labels": {
"enabled": true,
"formatter": null,
"style": {
"color": "#666666",
"cursor": "default",
"fontSize": "11px"
},
"useHTML": false
}
},
"zAxis": {
"title": {
"text": "Multi Score"
}
},
"plotOptions": {
"series": {
"dataLabels": {
"enabled": false,
"format": null,
"distance": 30,
"align": "center",
"inside": null,
"allowOverlap": false,
"style": {
"fontSize": "11px"
}
},
"showInLegend": null,
"turboThreshold": 0,
"stacking": "",
"groupPadding": 0.2,
"centerInCategory": false,
"findNearestPointBy": "x"
}
},
"navigator": {
"enabled": false
},
"scrollbar": {
"enabled": false
},
"rangeSelector": {
"enabled": false,
"inputEnabled": false
},
"legend": {
"enabled": null,
"maxHeight": null,
"align": "center",
"verticalAlign": "bottom",
"layout": "horizontal",
"width": null,
"margin": 12,
"reversed": false
},
"series": [
{
"name": "3 CPUs 4GB by Denv-R",
"color": "#1E9EDA",
"data": [
{
"x": 993.0357814818999,
"y": 2761.884998698788
},
{
"x": 982.562028186199,
"y": 2731.3654168908533
},
{
"x": 953.5927029398997,
"y": 2567.5317000237806
},
{
"x": 945.0154763334526,
"y": 2604.5138094922777
},
{
"x": 953.5271341435707,
"y": 2666.4675382582327
},
{
"x": 967.4077845444733,
"y": 2631.278332732174
},
{
"x": 912.7119914966872,
"y": 2477.821979185789
},
{
"x": 898.139300338815,
"y": 2467.6948160987267
},
{
"x": 942.4765622419259,
"y": 2657.367917153154
},
{
"x": 942.9306660822199,
"y": 2644.4223498663764
},
{
"x": 953.652956663035,
"y": 2742.687807919634
},
{
"x": 962.8480715901349,
"y": 2787.846650825647
}
]
}
],
"drilldown": {},
"tooltip": {
"enabled": true,
"useHTML": false,
"format": null,
"headerFormat": "",
"pointFormat": "<span style=\"color:{series.color}\">Single</span>: <b>{point.x:.0f}</b><br><span style=\"color:{series.color}\">Multi</span>: <b>{point.y:.0f}</b>",
"footerFormat": "",
"shared": false,
"outside": false,
"valueDecimals": null,
"split": false
},
"annotations": null
},
"hc_type": "chart",
"id": "42868992814149624651338352906415589629"
}
| Single | Multi | |
|---|---|---|
| Max | 993 | 2788 |
| Average | 951 | 2645 |
| Deviation | 25.21 | 99.54 |
| Min | 898 | 2468 |
Sign up as Freemium to get more insight.
- In same series
- 1 CPU 1GB
- 1 CPU 2GB
- 1 CPU 4GB
- 1 CPU 8GB
- 2 CPUs 2GB
- 2 CPUs 4GB
- 2 CPUs 8GB
- 2 CPUs 12GB
- 2 CPUs 16GB
- 3 CPUs 4GB
- 3 CPUs 8GB
- 3 CPUs 12GB
- 3 CPUs 16GB
- 3 CPUs 24GB
- 4 CPUs 4GB
- 4 CPUs 8GB
- 4 CPUs 12GB
- 4 CPUs 16GB
- 4 CPUs 24GB
- 4 CPUs 32GB
- 6 CPUs 8GB
- 6 CPUs 12GB
- 6 CPUs 16GB
- 6 CPUs 24GB
- 6 CPUs 32GB
- 6 CPUs 48GB
- 8 CPUs 8GB
- 8 CPUs 12GB
- 8 CPUs 16GB
- 8 CPUs 24GB
- 8 CPUs 32GB
- 8 CPUs 48GB
- 8 CPUs 64GB
- 12 CPUs 12GB
- 12 CPUs 16GB
- 12 CPUs 24GB
- 12 CPUs 32GB
- 12 CPUs 48GB
- 12 CPUs 64GB
- 16 CPUs 16GB
- 16 CPUs 24GB
- 16 CPUs 32GB
- 16 CPUs 48GB
- 16 CPUs 64GB