16CPU 32GHz 32GB Intel kvm by CloudSigma
Geekbench is a cross-platform processor benchmark with a scoring system that determines single-core and multi-core performance using loads simulating real-world scenarios. Geekbench 5 score is calculated with a reference score of 2500 representing the performance of the Intel Core i5-2520M @ 2.50 GHz. The software benchmark is available for Mac OS, Windows, Linux, Android and iOS platforms.
Specifications:
CPU
16
RAM
32.0 GB
{
"configuration": {
"chart": {
"type": "scatter",
"polar": false,
"zoomType": "",
"options3d": {},
"height": null,
"width": null,
"margin": null,
"inverted": false,
"zooming": {}
},
"credits": {
"enabled": false
},
"title": {
"text": ""
},
"colorAxis": null,
"subtitle": {
"text": ""
},
"xAxis": {
"title": {
"text": [
"Single Score"
],
"useHTML": false,
"style": {
"color": "#666666"
}
},
"categories": null,
"lineWidth": 1,
"tickInterval": null,
"tickWidth": 1,
"tickLength": 10,
"tickPixelInterval": 100,
"plotLines": null,
"labels": {
"enabled": true,
"format": null,
"formatter": "",
"style": {
"color": "#666666",
"cursor": "default",
"fontSize": "11px"
},
"useHTML": false,
"step": 0
},
"plotBands": null,
"visible": true,
"floor": null,
"ceiling": null,
"type": "linear",
"min": 0,
"gridLineWidth": 1,
"gridLineColor": "#e6e6e6",
"minorTickInterval": null,
"minorTickWidth": 0,
"minTickInterval": null,
"startOnTick": true,
"endOnTick": true,
"tickmarkPlacement": 100,
"units": 100,
"minRange": 100
},
"yAxis": {
"title": {
"text": [
"Multi Score"
],
"useHTML": false,
"style": {
"color": "#666666"
}
},
"categories": null,
"plotLines": null,
"plotBands": null,
"lineWidth": null,
"tickInterval": null,
"tickLength": 10,
"floor": null,
"ceiling": null,
"gridLineInterpolation": null,
"gridLineWidth": 1,
"gridLineColor": "#e6e6e6",
"min": 0,
"max": null,
"minorTickInterval": null,
"minorTickWidth": 0,
"minTickInterval": null,
"startOnTick": true,
"endOnTick": true,
"minRange": null,
"type": "linear",
"tickmarkPlacement": null,
"labels": {
"enabled": true,
"formatter": null,
"style": {
"color": "#666666",
"cursor": "default",
"fontSize": "11px"
},
"useHTML": false
}
},
"zAxis": {
"title": {
"text": "Multi Score"
}
},
"plotOptions": {
"series": {
"dataLabels": {
"enabled": false,
"format": null,
"distance": 30,
"align": "center",
"inside": null,
"allowOverlap": false,
"style": {
"fontSize": "11px"
}
},
"showInLegend": null,
"turboThreshold": 0,
"stacking": "",
"groupPadding": 0.2,
"centerInCategory": false,
"findNearestPointBy": "x"
}
},
"navigator": {
"enabled": false
},
"scrollbar": {
"enabled": false
},
"rangeSelector": {
"enabled": false,
"inputEnabled": false
},
"legend": {
"enabled": null,
"maxHeight": null,
"align": "center",
"verticalAlign": "bottom",
"layout": "horizontal",
"width": null,
"margin": 12,
"reversed": false
},
"series": [
{
"name": "16CPU 32GHz 32GB Intel kvm by CloudSigma",
"color": "#02aa4e",
"data": [
{
"x": 462.8470260986767,
"y": 4327.171173949671
},
{
"x": 458.97591294913144,
"y": 4227.904095889108
},
{
"x": 459.86454236115964,
"y": 4497.051018003685
},
{
"x": 424.82931705537175,
"y": 4338.643849690086
},
{
"x": 470.5713733066375,
"y": 4852.420108960459
},
{
"x": 430.33809999842043,
"y": 4364.5934077428265
},
{
"x": 466.6161723624754,
"y": 4572.123401495959
},
{
"x": 435.65233030240984,
"y": 4230.782160063331
},
{
"x": 464.64004100120724,
"y": 4511.890286803633
},
{
"x": 431.3235642322401,
"y": 4240.793630907102
},
{
"x": 468.42109810248996,
"y": 4662.042417815593
},
{
"x": 419.69329903713333,
"y": 4250.1084748889
},
{
"x": 467.8904511223596,
"y": 4943.141622014666
},
{
"x": 424.4510291800082,
"y": 4283.003648077208
},
{
"x": 454.0525239143449,
"y": 4427.623131821673
},
{
"x": 429.1066924098093,
"y": 4228.505988083057
},
{
"x": 452.0818283789019,
"y": 4377.309085273546
},
{
"x": 442.4062678883014,
"y": 4358.272994409162
},
{
"x": 461.06419638428326,
"y": 4405.688273125431
},
{
"x": 447.4869555694898,
"y": 4429.353530972318
}
]
}
],
"drilldown": {},
"tooltip": {
"enabled": true,
"useHTML": false,
"format": null,
"headerFormat": "",
"pointFormat": "<span style=\"color:{series.color}\">Single</span>: <b>{point.x:.0f}</b><br><span style=\"color:{series.color}\">Multi</span>: <b>{point.y:.0f}</b>",
"footerFormat": "",
"shared": false,
"outside": false,
"valueDecimals": null,
"split": false
},
"annotations": null
},
"hc_type": "chart",
"id": "320824385738600083072991529720929090492"
}
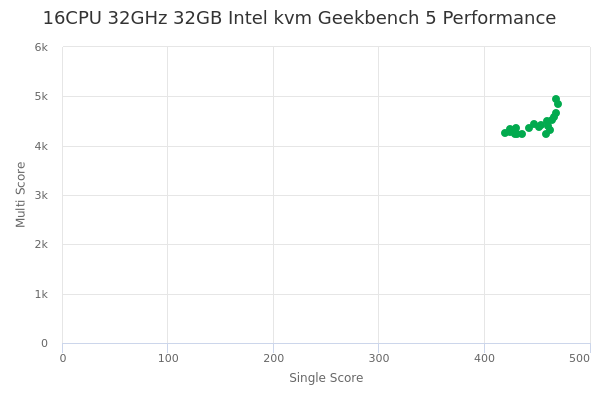
| Single | Multi | |
|---|---|---|
| Max | 471 | 4943 |
| Average | 449 | 4426 |
| Deviation | 16.83 | 196.13 |
| Min | 420 | 4228 |
Sign up as Freemium to get more insight.
- In same series
- 1CPU 2GHz 1GB Intel kvm
- 1CPU 2GHz 1.5GB Intel kvm
- 1CPU 2GHz 2GB Intel kvm
- 1CPU 2GHz 3GB Intel kvm
- 1CPU 2GHz 4GB Intel kvm
- 1CPU 2GHz 6GB Intel kvm
- 1CPU 2GHz 8GB Intel kvm
- 2CPU 4GHz 1GB Intel kvm
- 2CPU 4GHz 1.5GB Intel kvm
- 2CPU 4GHz 2GB Intel kvm
- 2CPU 4GHz 3GB Intel kvm
- 2CPU 4GHz 4GB Intel kvm
- 2CPU 4GHz 6GB Intel kvm
- 2CPU 4GHz 8GB Intel kvm
- 2CPU 4GHz 12GB Intel kvm
- 2CPU 4GHz 16GB Intel kvm
- 4CPU 8GHz 2GB Intel kvm
- 4CPU 8GHz 3GB Intel kvm
- 4CPU 8GHz 4GB Intel kvm
- 4CPU 8GHz 6GB Intel kvm
- 4CPU 8GHz 8GB Intel kvm
- 4CPU 8GHz 12GB Intel kvm
- 4CPU 8GHz 16GB Intel kvm
- 4CPU 8GHz 24GB Intel kvm
- 4CPU 8GHz 32GB Intel kvm
- 6CPU 12GHz 3GB Intel kvm
- 6CPU 12GHz 4GB Intel kvm
- 6CPU 12GHz 6GB Intel kvm
- 6CPU 12GHz 8GB Intel kvm
- 6CPU 12GHz 12GB Intel kvm
- 6CPU 12GHz 16GB Intel kvm
- 6CPU 12GHz 24GB Intel kvm
- 6CPU 12GHz 32GB Intel kvm
- 8CPU 16GHz 4GB Intel kvm
- 8CPU 16GHz 6GB Intel kvm
- 8CPU 16GHz 8GB Intel kvm
- 8CPU 16GHz 12GB Intel kvm
- 8CPU 16GHz 16GB Intel kvm
- 8CPU 16GHz 24GB Intel kvm
- 8CPU 16GHz 32GB Intel kvm
- 8CPU 16GHz 64GB Intel kvm
- 12CPU 24GHz 6GB Intel kvm
- 12CPU 24GHz 8GB Intel kvm
- 12CPU 24GHz 12GB Intel kvm
- 12CPU 24GHz 16GB Intel kvm
- 12CPU 24GHz 24GB Intel kvm
- 12CPU 24GHz 32GB Intel kvm
- 12CPU 24GHz 64GB Intel kvm
- 16CPU 32GHz 8GB Intel kvm
- 16CPU 32GHz 12GB Intel kvm
- 16CPU 32GHz 16GB Intel kvm
- 16CPU 32GHz 24GB Intel kvm
- 16CPU 32GHz 32GB Intel kvm
- 16CPU 32GHz 64GB Intel kvm
- 16CPU 32GHz 128GB Intel kvm
- 24CPU 48GHz 12GB Intel kvm
- 24CPU 48GHz 16GB Intel kvm
- 24CPU 48GHz 24GB Intel kvm
- 24CPU 48GHz 32GB Intel kvm
- 24CPU 48GHz 64GB Intel kvm
- 24CPU 48GHz 128GB Intel kvm
- 32CPU 64GHz 16GB Intel kvm
- 32CPU 64GHz 24GB Intel kvm
- 32CPU 64GHz 32GB Intel kvm
- 32CPU 64GHz 64GB Intel kvm
- 32CPU 64GHz 128GB Intel kvm
- 40CPU 80GHz 24GB Intel kvm
- 40CPU 80GHz 32GB Intel kvm
- 40CPU 80GHz 64GB Intel kvm
- 40CPU 80GHz 128GB Intel kvm