Standard_NV6 by Microsoft Azure
Geekbench is a cross-platform processor benchmark with a scoring system that determines single-core and multi-core performance using loads simulating real-world scenarios. Geekbench 5 score is calculated with a reference score of 2500 representing the performance of the Intel Core i5-2520M @ 2.50 GHz. The software benchmark is available for Mac OS, Windows, Linux, Android and iOS platforms.
Specifications:
CPU
6
RAM
56.0 GB
GPU
1
Tesla M60
Extra
1x
380 GB
N/A
{
"configuration": {
"chart": {
"type": "scatter",
"polar": false,
"zoomType": "",
"options3d": {},
"height": null,
"width": null,
"margin": null,
"inverted": false,
"zooming": {}
},
"credits": {
"enabled": false
},
"title": {
"text": ""
},
"colorAxis": null,
"subtitle": {
"text": ""
},
"xAxis": {
"title": {
"text": [
"Single Score"
],
"useHTML": false,
"style": {
"color": "#666666"
}
},
"categories": null,
"lineWidth": 1,
"tickInterval": null,
"tickWidth": 1,
"tickLength": 10,
"tickPixelInterval": 100,
"plotLines": null,
"labels": {
"enabled": true,
"format": null,
"formatter": "",
"style": {
"color": "#666666",
"cursor": "default",
"fontSize": "11px"
},
"useHTML": false,
"step": 0
},
"plotBands": null,
"visible": true,
"floor": null,
"ceiling": null,
"type": "linear",
"min": 0,
"gridLineWidth": 1,
"gridLineColor": "#e6e6e6",
"minorTickInterval": null,
"minorTickWidth": 0,
"minTickInterval": null,
"startOnTick": true,
"endOnTick": true,
"tickmarkPlacement": 100,
"units": 100,
"minRange": 100
},
"yAxis": {
"title": {
"text": [
"Multi Score"
],
"useHTML": false,
"style": {
"color": "#666666"
}
},
"categories": null,
"plotLines": null,
"plotBands": null,
"lineWidth": null,
"tickInterval": null,
"tickLength": 10,
"floor": null,
"ceiling": null,
"gridLineInterpolation": null,
"gridLineWidth": 1,
"gridLineColor": "#e6e6e6",
"min": 0,
"max": null,
"minorTickInterval": null,
"minorTickWidth": 0,
"minTickInterval": null,
"startOnTick": true,
"endOnTick": true,
"minRange": null,
"type": "linear",
"tickmarkPlacement": null,
"labels": {
"enabled": true,
"formatter": null,
"style": {
"color": "#666666",
"cursor": "default",
"fontSize": "11px"
},
"useHTML": false
}
},
"zAxis": {
"title": {
"text": "Multi Score"
}
},
"plotOptions": {
"series": {
"dataLabels": {
"enabled": false,
"format": null,
"distance": 30,
"align": "center",
"inside": null,
"allowOverlap": false,
"style": {
"fontSize": "11px"
}
},
"showInLegend": null,
"turboThreshold": 0,
"stacking": "",
"groupPadding": 0.2,
"centerInCategory": false,
"findNearestPointBy": "x"
}
},
"navigator": {
"enabled": false
},
"scrollbar": {
"enabled": false
},
"rangeSelector": {
"enabled": false,
"inputEnabled": false
},
"legend": {
"enabled": null,
"maxHeight": null,
"align": "center",
"verticalAlign": "bottom",
"layout": "horizontal",
"width": null,
"margin": 12,
"reversed": false
},
"series": [
{
"name": "Standard_NV6 by Microsoft Azure",
"color": "#55b3ff",
"data": [
{
"x": 831.658314734954,
"y": 4546.3221343746145
},
{
"x": 823.8790444584911,
"y": 4540.1942824123435
},
{
"x": 834.5556160604986,
"y": 4525.762400611686
},
{
"x": 821.4408932415417,
"y": 4588.476868429728
},
{
"x": 833.4276766812172,
"y": 4635.171733263809
},
{
"x": 822.7103164656066,
"y": 4526.952089545235
},
{
"x": 817.4529962835728,
"y": 4587.385938746142
},
{
"x": 816.6360721661007,
"y": 4560.881930573278
},
{
"x": 826.0812059532617,
"y": 4561.890162722301
},
{
"x": 829.693490910502,
"y": 4548.054687164848
},
{
"x": 835.7414197668627,
"y": 4569.953421115833
},
{
"x": 820.3506700648369,
"y": 4569.10541897113
},
{
"x": 830.4801797873879,
"y": 4580.345129202726
},
{
"x": 828.8021871915803,
"y": 4598.164944572944
},
{
"x": 830.7501895261759,
"y": 4578.4209477167215
},
{
"x": 827.9052571400483,
"y": 4591.25174980984
},
{
"x": 831.471625484154,
"y": 4606.95709794542
},
{
"x": 830.3131154142977,
"y": 4593.207352818693
},
{
"x": 834.9673876254752,
"y": 4590.876058034231
},
{
"x": 829.5686948130847,
"y": 4594.783014663955
}
]
}
],
"drilldown": {},
"tooltip": {
"enabled": true,
"useHTML": false,
"format": null,
"headerFormat": "",
"pointFormat": "<span style=\"color:{series.color}\">Single</span>: <b>{point.x:.0f}</b><br><span style=\"color:{series.color}\">Multi</span>: <b>{point.y:.0f}</b>",
"footerFormat": "",
"shared": false,
"outside": false,
"valueDecimals": null,
"split": false
},
"annotations": null
},
"hc_type": "chart",
"id": "39199278992686863668533454477005332641"
}
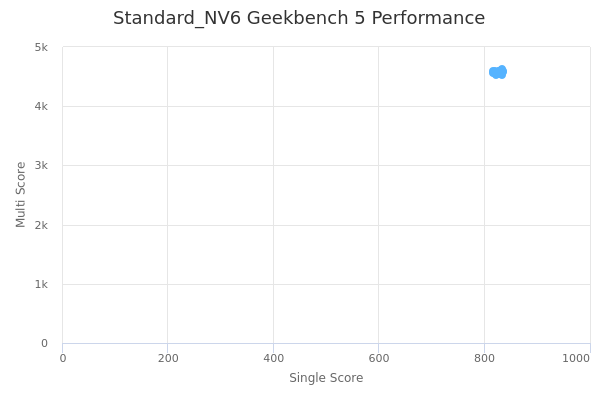
| Single | Multi | |
|---|---|---|
| Max | 836 | 4635 |
| Average | 828 | 4575 |
| Deviation | 5.58 | 27.13 |
| Min | 817 | 4526 |
Sign up as Freemium to get more insight.
- In same series
- Standard_NV6
- Standard_NV12
- Standard_NV24