Standard_ND6s by Microsoft Azure
Geekbench is a cross-platform processor benchmark with a scoring system that determines single-core and multi-core performance using loads simulating real-world scenarios. Geekbench 5 score is calculated with a reference score of 2500 representing the performance of the Intel Core i5-2520M @ 2.50 GHz. The software benchmark is available for Mac OS, Windows, Linux, Android and iOS platforms.
Specifications:
CPU
6
RAM
112.0 GB
GPU
1
Tesla P40
Extra
1x
736 GB
N/A
{
"configuration": {
"chart": {
"type": "scatter",
"polar": false,
"zoomType": "",
"options3d": {},
"height": null,
"width": null,
"margin": null,
"inverted": false,
"zooming": {}
},
"credits": {
"enabled": false
},
"title": {
"text": ""
},
"colorAxis": null,
"subtitle": {
"text": ""
},
"xAxis": {
"title": {
"text": [
"Single Score"
],
"useHTML": false,
"style": {
"color": "#666666"
}
},
"categories": null,
"lineWidth": 1,
"tickInterval": null,
"tickWidth": 1,
"tickLength": 10,
"tickPixelInterval": 100,
"plotLines": null,
"labels": {
"enabled": true,
"format": null,
"formatter": "",
"style": {
"color": "#666666",
"cursor": "default",
"fontSize": "11px"
},
"useHTML": false,
"step": 0
},
"plotBands": null,
"visible": true,
"floor": null,
"ceiling": null,
"type": "linear",
"min": 0,
"gridLineWidth": 1,
"gridLineColor": "#e6e6e6",
"minorTickInterval": null,
"minorTickWidth": 0,
"minTickInterval": null,
"startOnTick": true,
"endOnTick": true,
"tickmarkPlacement": 100,
"units": 100,
"minRange": 100
},
"yAxis": {
"title": {
"text": [
"Multi Score"
],
"useHTML": false,
"style": {
"color": "#666666"
}
},
"categories": null,
"plotLines": null,
"plotBands": null,
"lineWidth": null,
"tickInterval": null,
"tickLength": 10,
"floor": null,
"ceiling": null,
"gridLineInterpolation": null,
"gridLineWidth": 1,
"gridLineColor": "#e6e6e6",
"min": 0,
"max": null,
"minorTickInterval": null,
"minorTickWidth": 0,
"minTickInterval": null,
"startOnTick": true,
"endOnTick": true,
"minRange": null,
"type": "linear",
"tickmarkPlacement": null,
"labels": {
"enabled": true,
"formatter": null,
"style": {
"color": "#666666",
"cursor": "default",
"fontSize": "11px"
},
"useHTML": false
}
},
"zAxis": {
"title": {
"text": "Multi Score"
}
},
"plotOptions": {
"series": {
"dataLabels": {
"enabled": false,
"format": null,
"distance": 30,
"align": "center",
"inside": null,
"allowOverlap": false,
"style": {
"fontSize": "11px"
}
},
"showInLegend": null,
"turboThreshold": 0,
"stacking": "",
"groupPadding": 0.2,
"centerInCategory": false,
"findNearestPointBy": "x"
}
},
"navigator": {
"enabled": false
},
"scrollbar": {
"enabled": false
},
"rangeSelector": {
"enabled": false,
"inputEnabled": false
},
"legend": {
"enabled": null,
"maxHeight": null,
"align": "center",
"verticalAlign": "bottom",
"layout": "horizontal",
"width": null,
"margin": 12,
"reversed": false
},
"series": [
{
"name": "Standard_ND6s by Microsoft Azure",
"color": "#55b3ff",
"data": [
{
"x": 871.1615813645176,
"y": 4880.6291508009
},
{
"x": 861.8469598527224,
"y": 4859.344764477402
},
{
"x": 873.5214297745713,
"y": 4844.413636963163
},
{
"x": 872.2286599666251,
"y": 4820.479459555883
},
{
"x": 872.57655245864,
"y": 4862.461326949533
},
{
"x": 874.8361355990165,
"y": 4870.913587878103
},
{
"x": 878.6266290063154,
"y": 4856.245124927977
},
{
"x": 871.9008658148216,
"y": 4854.240017647044
},
{
"x": 874.9645651073862,
"y": 4854.587973365956
},
{
"x": 873.6653386224335,
"y": 4866.1239849563635
},
{
"x": 881.6807947604273,
"y": 4813.005415328159
},
{
"x": 871.856077379869,
"y": 4864.478347589108
},
{
"x": 872.1104263424975,
"y": 4852.75793693079
},
{
"x": 872.6546639323708,
"y": 4859.170762193906
},
{
"x": 879.9367438470692,
"y": 4859.678370110694
},
{
"x": 874.0541854652001,
"y": 4832.404605487187
},
{
"x": 867.1238506259276,
"y": 4882.569549223409
},
{
"x": 875.7844140923355,
"y": 4859.633219719352
},
{
"x": 873.6254503133165,
"y": 4886.098018162444
},
{
"x": 875.1659917969458,
"y": 4825.391737914617
}
]
}
],
"drilldown": {},
"tooltip": {
"enabled": true,
"useHTML": false,
"format": null,
"headerFormat": "",
"pointFormat": "<span style=\"color:{series.color}\">Single</span>: <b>{point.x:.0f}</b><br><span style=\"color:{series.color}\">Multi</span>: <b>{point.y:.0f}</b>",
"footerFormat": "",
"shared": false,
"outside": false,
"valueDecimals": null,
"split": false
},
"annotations": null
},
"hc_type": "chart",
"id": "64092716091805145090445689810610367881"
}
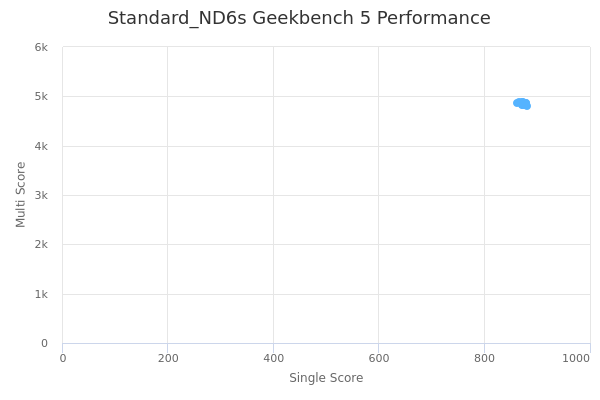
| Single | Multi | |
|---|---|---|
| Max | 882 | 4886 |
| Average | 873 | 4855 |
| Deviation | 4.12 | 19.30 |
| Min | 862 | 4813 |
Sign up as Freemium to get more insight.
- In same series
- Standard_ND6s
- Standard_ND12s
- Standard_ND24s