Standard_NC6s_v3 by Microsoft Azure
Geekbench is a cross-platform processor benchmark with a scoring system that determines single-core and multi-core performance using loads simulating real-world scenarios. Geekbench 5 score is calculated with a reference score of 2500 representing the performance of the Intel Core i5-2520M @ 2.50 GHz. The software benchmark is available for Mac OS, Windows, Linux, Android and iOS platforms.
Specifications:
CPU
6
RAM
112.0 GB
GPU
1
Extra
1x
736 GB
N/A
{
"configuration": {
"chart": {
"type": "scatter",
"polar": false,
"zoomType": "",
"options3d": {},
"height": null,
"width": null,
"margin": null,
"inverted": false,
"zooming": {}
},
"credits": {
"enabled": false
},
"title": {
"text": ""
},
"colorAxis": null,
"subtitle": {
"text": ""
},
"xAxis": {
"title": {
"text": [
"Single Score"
],
"useHTML": false,
"style": {
"color": "#666666"
}
},
"categories": null,
"lineWidth": 1,
"tickInterval": null,
"tickWidth": 1,
"tickLength": 10,
"tickPixelInterval": 100,
"plotLines": null,
"labels": {
"enabled": true,
"format": null,
"formatter": "",
"style": {
"color": "#666666",
"cursor": "default",
"fontSize": "11px"
},
"useHTML": false,
"step": 0
},
"plotBands": null,
"visible": true,
"floor": null,
"ceiling": null,
"type": "linear",
"min": 0,
"gridLineWidth": 1,
"gridLineColor": "#e6e6e6",
"minorTickInterval": null,
"minorTickWidth": 0,
"minTickInterval": null,
"startOnTick": true,
"endOnTick": true,
"tickmarkPlacement": 100,
"units": 100,
"minRange": 100
},
"yAxis": {
"title": {
"text": [
"Multi Score"
],
"useHTML": false,
"style": {
"color": "#666666"
}
},
"categories": null,
"plotLines": null,
"plotBands": null,
"lineWidth": null,
"tickInterval": null,
"tickLength": 10,
"floor": null,
"ceiling": null,
"gridLineInterpolation": null,
"gridLineWidth": 1,
"gridLineColor": "#e6e6e6",
"min": 0,
"max": null,
"minorTickInterval": null,
"minorTickWidth": 0,
"minTickInterval": null,
"startOnTick": true,
"endOnTick": true,
"minRange": null,
"type": "linear",
"tickmarkPlacement": null,
"labels": {
"enabled": true,
"formatter": null,
"style": {
"color": "#666666",
"cursor": "default",
"fontSize": "11px"
},
"useHTML": false
}
},
"zAxis": {
"title": {
"text": "Multi Score"
}
},
"plotOptions": {
"series": {
"dataLabels": {
"enabled": false,
"format": null,
"distance": 30,
"align": "center",
"inside": null,
"allowOverlap": false,
"style": {
"fontSize": "11px"
}
},
"showInLegend": null,
"turboThreshold": 0,
"stacking": "",
"groupPadding": 0.2,
"centerInCategory": false,
"findNearestPointBy": "x"
}
},
"navigator": {
"enabled": false
},
"scrollbar": {
"enabled": false
},
"rangeSelector": {
"enabled": false,
"inputEnabled": false
},
"legend": {
"enabled": null,
"maxHeight": null,
"align": "center",
"verticalAlign": "bottom",
"layout": "horizontal",
"width": null,
"margin": 12,
"reversed": false
},
"series": [
{
"name": "Standard_NC6s_v3 by Microsoft Azure",
"color": "#55b3ff",
"data": [
{
"x": 886.5737375359834,
"y": 4921.3856523757895
},
{
"x": 871.8651106189377,
"y": 4862.159704270342
},
{
"x": 890.447550441206,
"y": 4851.5709168774365
},
{
"x": 870.4725118653178,
"y": 4831.663256042128
},
{
"x": 886.3937181672277,
"y": 4903.252556814745
},
{
"x": 877.2824858687245,
"y": 4856.812228578768
},
{
"x": 891.7139958143878,
"y": 4884.964170505182
},
{
"x": 868.6860756196904,
"y": 4816.724688698129
},
{
"x": 893.6133665322302,
"y": 4914.35739748038
},
{
"x": 870.9022093408822,
"y": 4870.807054219355
},
{
"x": 886.2488230982534,
"y": 4883.488353858782
},
{
"x": 871.3771487654636,
"y": 4820.390586079468
},
{
"x": 887.3010010978364,
"y": 4891.169405395222
},
{
"x": 870.8140820433304,
"y": 4834.713277762545
},
{
"x": 890.7066386919039,
"y": 4890.361444322996
},
{
"x": 870.0901181483664,
"y": 4826.837153348258
},
{
"x": 889.5626507906609,
"y": 4903.505361446809
},
{
"x": 868.1057590089946,
"y": 4862.548679780439
},
{
"x": 891.9252670270914,
"y": 4844.447362460589
},
{
"x": 870.6091194368629,
"y": 4837.072993921143
}
]
}
],
"drilldown": {},
"tooltip": {
"enabled": true,
"useHTML": false,
"format": null,
"headerFormat": "",
"pointFormat": "<span style=\"color:{series.color}\">Single</span>: <b>{point.x:.0f}</b><br><span style=\"color:{series.color}\">Multi</span>: <b>{point.y:.0f}</b>",
"footerFormat": "",
"shared": false,
"outside": false,
"valueDecimals": null,
"split": false
},
"annotations": null
},
"hc_type": "chart",
"id": "98546571381231417971810027170863972086"
}
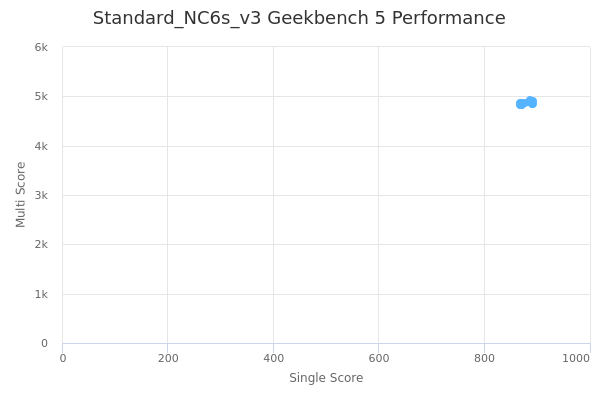
| Single | Multi | |
|---|---|---|
| Max | 894 | 4921 |
| Average | 880 | 4865 |
| Deviation | 9.53 | 31.57 |
| Min | 868 | 4817 |
Sign up as Freemium to get more insight.
- In same series
- Standard_NC6s_v3
- Standard_NC12s_v3
- Standard_NC24s_v3