Standard_NC6s_v2 by Microsoft Azure
Geekbench is a cross-platform processor benchmark with a scoring system that determines single-core and multi-core performance using loads simulating real-world scenarios. Geekbench 5 score is calculated with a reference score of 2500 representing the performance of the Intel Core i5-2520M @ 2.50 GHz. The software benchmark is available for Mac OS, Windows, Linux, Android and iOS platforms.
Specifications:
CPU
6
RAM
112.0 GB
GPU
1
Tesla P100
Extra
1x
736 GB
N/A
{
"configuration": {
"chart": {
"type": "scatter",
"polar": false,
"zoomType": "",
"options3d": {},
"height": null,
"width": null,
"margin": null,
"inverted": false,
"zooming": {}
},
"credits": {
"enabled": false
},
"title": {
"text": ""
},
"colorAxis": null,
"subtitle": {
"text": ""
},
"xAxis": {
"title": {
"text": [
"Single Score"
],
"useHTML": false,
"style": {
"color": "#666666"
}
},
"categories": null,
"lineWidth": 1,
"tickInterval": null,
"tickWidth": 1,
"tickLength": 10,
"tickPixelInterval": 100,
"plotLines": null,
"labels": {
"enabled": true,
"format": null,
"formatter": "",
"style": {
"color": "#666666",
"cursor": "default",
"fontSize": "11px"
},
"useHTML": false,
"step": 0
},
"plotBands": null,
"visible": true,
"floor": null,
"ceiling": null,
"type": "linear",
"min": 0,
"gridLineWidth": 1,
"gridLineColor": "#e6e6e6",
"minorTickInterval": null,
"minorTickWidth": 0,
"minTickInterval": null,
"startOnTick": true,
"endOnTick": true,
"tickmarkPlacement": 100,
"units": 100,
"minRange": 100
},
"yAxis": {
"title": {
"text": [
"Multi Score"
],
"useHTML": false,
"style": {
"color": "#666666"
}
},
"categories": null,
"plotLines": null,
"plotBands": null,
"lineWidth": null,
"tickInterval": null,
"tickLength": 10,
"floor": null,
"ceiling": null,
"gridLineInterpolation": null,
"gridLineWidth": 1,
"gridLineColor": "#e6e6e6",
"min": 0,
"max": null,
"minorTickInterval": null,
"minorTickWidth": 0,
"minTickInterval": null,
"startOnTick": true,
"endOnTick": true,
"minRange": null,
"type": "linear",
"tickmarkPlacement": null,
"labels": {
"enabled": true,
"formatter": null,
"style": {
"color": "#666666",
"cursor": "default",
"fontSize": "11px"
},
"useHTML": false
}
},
"zAxis": {
"title": {
"text": "Multi Score"
}
},
"plotOptions": {
"series": {
"dataLabels": {
"enabled": false,
"format": null,
"distance": 30,
"align": "center",
"inside": null,
"allowOverlap": false,
"style": {
"fontSize": "11px"
}
},
"showInLegend": null,
"turboThreshold": 0,
"stacking": "",
"groupPadding": 0.2,
"centerInCategory": false,
"findNearestPointBy": "x"
}
},
"navigator": {
"enabled": false
},
"scrollbar": {
"enabled": false
},
"rangeSelector": {
"enabled": false,
"inputEnabled": false
},
"legend": {
"enabled": null,
"maxHeight": null,
"align": "center",
"verticalAlign": "bottom",
"layout": "horizontal",
"width": null,
"margin": 12,
"reversed": false
},
"series": [
{
"name": "Standard_NC6s_v2 by Microsoft Azure",
"color": "#55b3ff",
"data": [
{
"x": 886.2617465866608,
"y": 4877.29631291844
},
{
"x": 844.2525987019907,
"y": 4462.371922789306
},
{
"x": 885.4615420174863,
"y": 4888.499357026497
},
{
"x": 810.3039381731612,
"y": 4211.4908128228535
},
{
"x": 885.8748598876449,
"y": 4905.8846383725095
},
{
"x": 824.5914486310564,
"y": 4371.2432797336505
},
{
"x": 885.2456064397838,
"y": 4847.090833067571
},
{
"x": 844.2950047026826,
"y": 4338.215190482976
},
{
"x": 885.1258389355511,
"y": 4897.47216239195
},
{
"x": 850.1348601726415,
"y": 4393.9547153317235
},
{
"x": 883.934264879874,
"y": 4889.251728029379
},
{
"x": 833.8685261704118,
"y": 4499.355919029289
},
{
"x": 880.534180725311,
"y": 4895.523795908216
},
{
"x": 880.7438223276735,
"y": 4802.41103808896
},
{
"x": 883.7117454428092,
"y": 4872.554875756905
},
{
"x": 883.5707144326063,
"y": 4872.63293061736
},
{
"x": 865.0638840977405,
"y": 4776.512438858833
},
{
"x": 877.9793609477372,
"y": 4893.744143215642
},
{
"x": 885.4420553639281,
"y": 4872.903744683557
},
{
"x": 882.7364952714793,
"y": 4896.131013925428
}
]
}
],
"drilldown": {},
"tooltip": {
"enabled": true,
"useHTML": false,
"format": null,
"headerFormat": "",
"pointFormat": "<span style=\"color:{series.color}\">Single</span>: <b>{point.x:.0f}</b><br><span style=\"color:{series.color}\">Multi</span>: <b>{point.y:.0f}</b>",
"footerFormat": "",
"shared": false,
"outside": false,
"valueDecimals": null,
"split": false
},
"annotations": null
},
"hc_type": "chart",
"id": "283844535601628205068757610509112602140"
}
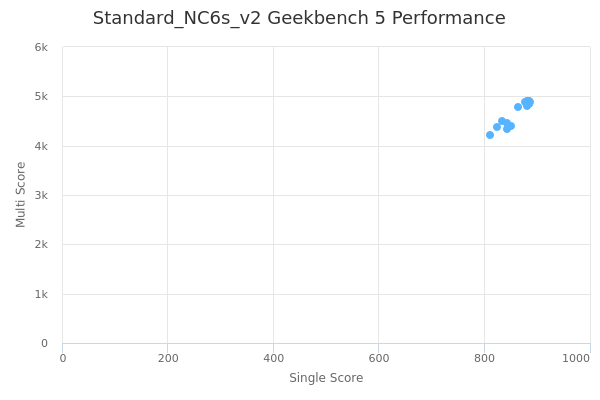
| Single | Multi | |
|---|---|---|
| Max | 886 | 4906 |
| Average | 868 | 4723 |
| Deviation | 23.52 | 232.71 |
| Min | 810 | 4211 |
Sign up as Freemium to get more insight.
- In same series
- Standard_NC6s_v2
- Standard_NC12s_v2
- Standard_NC24s_v2