Standard_E8-2s_v3 by Microsoft Azure
Geekbench is a cross-platform processor benchmark with a scoring system that determines single-core and multi-core performance using loads simulating real-world scenarios. Geekbench 5 score is calculated with a reference score of 2500 representing the performance of the Intel Core i5-2520M @ 2.50 GHz. The software benchmark is available for Mac OS, Windows, Linux, Android and iOS platforms.
Specifications:
CPU
8
RAM
64.0 GB
Extra
1x
128 GB
N/A
{
"configuration": {
"chart": {
"type": "scatter",
"polar": false,
"zoomType": "",
"options3d": {},
"height": null,
"width": null,
"margin": null,
"inverted": false,
"zooming": {}
},
"credits": {
"enabled": false
},
"title": {
"text": ""
},
"colorAxis": null,
"subtitle": {
"text": ""
},
"xAxis": {
"title": {
"text": [
"Single Score"
],
"useHTML": false,
"style": {
"color": "#666666"
}
},
"categories": null,
"lineWidth": 1,
"tickInterval": null,
"tickWidth": 1,
"tickLength": 10,
"tickPixelInterval": 100,
"plotLines": null,
"labels": {
"enabled": true,
"format": null,
"formatter": "",
"style": {
"color": "#666666",
"cursor": "default",
"fontSize": "11px"
},
"useHTML": false,
"step": 0
},
"plotBands": null,
"visible": true,
"floor": null,
"ceiling": null,
"type": "linear",
"min": 0,
"gridLineWidth": 1,
"gridLineColor": "#e6e6e6",
"minorTickInterval": null,
"minorTickWidth": 0,
"minTickInterval": null,
"startOnTick": true,
"endOnTick": true,
"tickmarkPlacement": 100,
"units": 100,
"minRange": 100
},
"yAxis": {
"title": {
"text": [
"Multi Score"
],
"useHTML": false,
"style": {
"color": "#666666"
}
},
"categories": null,
"plotLines": null,
"plotBands": null,
"lineWidth": null,
"tickInterval": null,
"tickLength": 10,
"floor": null,
"ceiling": null,
"gridLineInterpolation": null,
"gridLineWidth": 1,
"gridLineColor": "#e6e6e6",
"min": 0,
"max": null,
"minorTickInterval": null,
"minorTickWidth": 0,
"minTickInterval": null,
"startOnTick": true,
"endOnTick": true,
"minRange": null,
"type": "linear",
"tickmarkPlacement": null,
"labels": {
"enabled": true,
"formatter": null,
"style": {
"color": "#666666",
"cursor": "default",
"fontSize": "11px"
},
"useHTML": false
}
},
"zAxis": {
"title": {
"text": "Multi Score"
}
},
"plotOptions": {
"series": {
"dataLabels": {
"enabled": false,
"format": null,
"distance": 30,
"align": "center",
"inside": null,
"allowOverlap": false,
"style": {
"fontSize": "11px"
}
},
"showInLegend": null,
"turboThreshold": 0,
"stacking": "",
"groupPadding": 0.2,
"centerInCategory": false,
"findNearestPointBy": "x"
}
},
"navigator": {
"enabled": false
},
"scrollbar": {
"enabled": false
},
"rangeSelector": {
"enabled": false,
"inputEnabled": false
},
"legend": {
"enabled": null,
"maxHeight": null,
"align": "center",
"verticalAlign": "bottom",
"layout": "horizontal",
"width": null,
"margin": 12,
"reversed": false
},
"series": [
{
"name": "Standard_E8-2s_v3 by Microsoft Azure",
"color": "#55b3ff",
"data": [
{
"x": 874.7772723282338,
"y": 1032.483157090132
},
{
"x": 841.2004159511174,
"y": 1013.265648073458
},
{
"x": 870.4719481002501,
"y": 1035.184208770078
},
{
"x": 850.0973206188,
"y": 1022.2838697124
},
{
"x": 872.7711147038287,
"y": 1035.8509012402258
},
{
"x": 854.6609883764856,
"y": 1017.0508325003921
},
{
"x": 866.6133603571698,
"y": 1041.8642348775902
},
{
"x": 854.1379163959523,
"y": 1022.0892158207806
},
{
"x": 878.233390586739,
"y": 1041.8594390917092
},
{
"x": 852.1323004396291,
"y": 1017.7837774183868
},
{
"x": 878.6854210098766,
"y": 1032.6852123120768
},
{
"x": 856.5668356669423,
"y": 1020.0209025783793
},
{
"x": 879.3657536531846,
"y": 1043.1861016895423
},
{
"x": 858.7139271328956,
"y": 1022.6000499489062
},
{
"x": 880.1253205899307,
"y": 1040.941858026602
},
{
"x": 861.9204272801717,
"y": 1025.0140601127048
},
{
"x": 878.7702743407978,
"y": 1042.7329159280994
},
{
"x": 859.1051064703881,
"y": 1020.4802572910717
},
{
"x": 875.2726580445408,
"y": 1043.2968426956973
},
{
"x": 854.7218300228626,
"y": 1018.2263204496263
}
]
}
],
"drilldown": {},
"tooltip": {
"enabled": true,
"useHTML": false,
"format": null,
"headerFormat": "",
"pointFormat": "<span style=\"color:{series.color}\">Single</span>: <b>{point.x:.0f}</b><br><span style=\"color:{series.color}\">Multi</span>: <b>{point.y:.0f}</b>",
"footerFormat": "",
"shared": false,
"outside": false,
"valueDecimals": null,
"split": false
},
"annotations": null
},
"hc_type": "chart",
"id": "243394584203211115914342794556317386833"
}
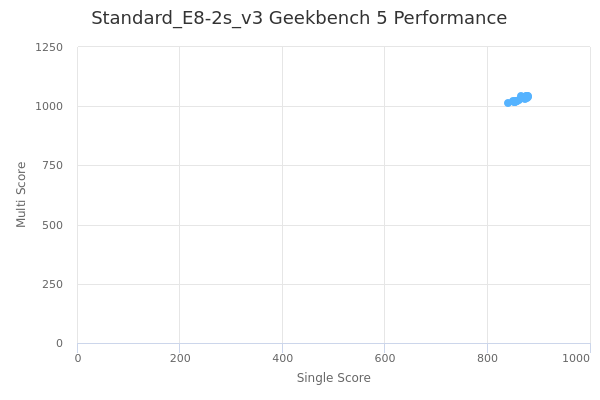
| Single | Multi | |
|---|---|---|
| Max | 880 | 1043 |
| Average | 865 | 1029 |
| Deviation | 11.66 | 10.27 |
| Min | 841 | 1013 |
Sign up as Freemium to get more insight.
- In same series
- Standard_E2s_v3
- Standard_E4-2s_v3
- Standard_E4s_v3
- Standard_E8-2s_v3
- Standard_E8-4s_v3
- Standard_E8s_v3
- Standard_E16-4s_v3
- Standard_E16-8s_v3
- Standard_E16s_v3
- Standard_E20s_v3
- Standard_E32-16s_v3
- Standard_E32-8s_v3
- Standard_E32s_v3
- Standard_E48s_v3
- Standard_E64-16s_v3
- Standard_E64-32s_v3
- Standard_E64s_v3