Standard_D2s_v4 by Microsoft Azure
Geekbench is a cross-platform processor benchmark with a scoring system that determines single-core and multi-core performance using loads simulating real-world scenarios. Geekbench 5 score is calculated with a reference score of 2500 representing the performance of the Intel Core i5-2520M @ 2.50 GHz. The software benchmark is available for Mac OS, Windows, Linux, Android and iOS platforms.
Specifications:
CPU
2
RAM
8.0 GB
Net
1000 Mbps
{
"configuration": {
"chart": {
"type": "scatter",
"polar": false,
"zoomType": "",
"options3d": {},
"height": null,
"width": null,
"margin": null,
"inverted": false,
"zooming": {}
},
"credits": {
"enabled": false
},
"title": {
"text": ""
},
"colorAxis": null,
"subtitle": {
"text": ""
},
"xAxis": {
"title": {
"text": [
"Single Score"
],
"useHTML": false,
"style": {
"color": "#666666"
}
},
"categories": null,
"lineWidth": 1,
"tickInterval": null,
"tickWidth": 1,
"tickLength": 10,
"tickPixelInterval": 100,
"plotLines": null,
"labels": {
"enabled": true,
"format": null,
"formatter": "",
"style": {
"color": "#666666",
"cursor": "default",
"fontSize": "11px"
},
"useHTML": false,
"step": 0
},
"plotBands": null,
"visible": true,
"floor": null,
"ceiling": null,
"type": "linear",
"min": 0,
"gridLineWidth": 1,
"gridLineColor": "#e6e6e6",
"minorTickInterval": null,
"minorTickWidth": 0,
"minTickInterval": null,
"startOnTick": true,
"endOnTick": true,
"tickmarkPlacement": 100,
"units": 100,
"minRange": 100
},
"yAxis": {
"title": {
"text": [
"Multi Score"
],
"useHTML": false,
"style": {
"color": "#666666"
}
},
"categories": null,
"plotLines": null,
"plotBands": null,
"lineWidth": null,
"tickInterval": null,
"tickLength": 10,
"floor": null,
"ceiling": null,
"gridLineInterpolation": null,
"gridLineWidth": 1,
"gridLineColor": "#e6e6e6",
"min": 0,
"max": null,
"minorTickInterval": null,
"minorTickWidth": 0,
"minTickInterval": null,
"startOnTick": true,
"endOnTick": true,
"minRange": null,
"type": "linear",
"tickmarkPlacement": null,
"labels": {
"enabled": true,
"formatter": null,
"style": {
"color": "#666666",
"cursor": "default",
"fontSize": "11px"
},
"useHTML": false
}
},
"zAxis": {
"title": {
"text": "Multi Score"
}
},
"plotOptions": {
"series": {
"dataLabels": {
"enabled": false,
"format": null,
"distance": 30,
"align": "center",
"inside": null,
"allowOverlap": false,
"style": {
"fontSize": "11px"
}
},
"showInLegend": null,
"turboThreshold": 0,
"stacking": "",
"groupPadding": 0.2,
"centerInCategory": false,
"findNearestPointBy": "x"
}
},
"navigator": {
"enabled": false
},
"scrollbar": {
"enabled": false
},
"rangeSelector": {
"enabled": false,
"inputEnabled": false
},
"legend": {
"enabled": null,
"maxHeight": null,
"align": "center",
"verticalAlign": "bottom",
"layout": "horizontal",
"width": null,
"margin": 12,
"reversed": false
},
"series": [
{
"name": "Standard_D2s_v4 by Microsoft Azure",
"color": "#55b3ff",
"data": [
{
"x": 978.6017847415203,
"y": 1167.1130920998835
},
{
"x": 777.1083932654693,
"y": 976.1182160808112
},
{
"x": 981.628112108602,
"y": 1165.9551822860055
},
{
"x": 781.6008272730577,
"y": 972.118940642026
},
{
"x": 978.7333403976227,
"y": 1163.0752246152235
},
{
"x": 801.0273101822586,
"y": 992.2396939484495
},
{
"x": 982.7073688246381,
"y": 1168.686695603346
},
{
"x": 783.9430418132246,
"y": 971.267832441036
},
{
"x": 994.2761969499047,
"y": 1170.3708889996474
},
{
"x": 797.7598436130257,
"y": 987.3217171769641
},
{
"x": 990.7584398519209,
"y": 1170.9317840110084
},
{
"x": 988.5504678944608,
"y": 1173.3249557214037
},
{
"x": 790.088839091983,
"y": 989.2351214445914
},
{
"x": 989.3207302201699,
"y": 1172.2237077825926
},
{
"x": 786.9996506014277,
"y": 995.0063096876802
},
{
"x": 991.2441878238275,
"y": 1173.4748622780346
},
{
"x": 788.9487888121033,
"y": 986.7097195608642
},
{
"x": 986.481998876053,
"y": 1175.5385212324843
},
{
"x": 789.5665551373542,
"y": 983.0120107396664
},
{
"x": 777.7617754881442,
"y": 978.8250483977771
}
]
}
],
"drilldown": {},
"tooltip": {
"enabled": true,
"useHTML": false,
"format": null,
"headerFormat": "",
"pointFormat": "<span style=\"color:{series.color}\">Single</span>: <b>{point.x:.0f}</b><br><span style=\"color:{series.color}\">Multi</span>: <b>{point.y:.0f}</b>",
"footerFormat": "",
"shared": false,
"outside": false,
"valueDecimals": null,
"split": false
},
"annotations": null
},
"hc_type": "chart",
"id": "270379937431343261210249873664191347655"
}
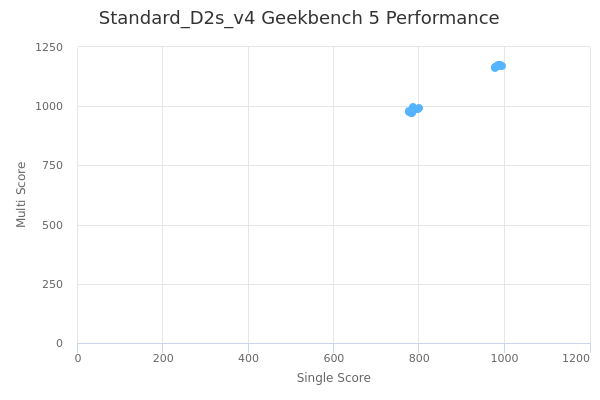
| Single | Multi | |
|---|---|---|
| Max | 994 | 1176 |
| Average | 887 | 1077 |
| Deviation | 99.58 | 93.64 |
| Min | 777 | 971 |
Sign up as Freemium to get more insight.