Standard_D2ds_v4 by Microsoft Azure
Geekbench is a cross-platform processor benchmark with a scoring system that determines single-core and multi-core performance using loads simulating real-world scenarios. Geekbench 5 score is calculated with a reference score of 2500 representing the performance of the Intel Core i5-2520M @ 2.50 GHz. The software benchmark is available for Mac OS, Windows, Linux, Android and iOS platforms.
Specifications:
CPU
2
RAM
8.0 GB
Extra
1x
75 GB
N/A
{
"configuration": {
"chart": {
"type": "scatter",
"polar": false,
"zoomType": "",
"options3d": {},
"height": null,
"width": null,
"margin": null,
"inverted": false,
"zooming": {}
},
"credits": {
"enabled": false
},
"title": {
"text": ""
},
"colorAxis": null,
"subtitle": {
"text": ""
},
"xAxis": {
"title": {
"text": [
"Single Score"
],
"useHTML": false,
"style": {
"color": "#666666"
}
},
"categories": null,
"lineWidth": 1,
"tickInterval": null,
"tickWidth": 1,
"tickLength": 10,
"tickPixelInterval": 100,
"plotLines": null,
"labels": {
"enabled": true,
"format": null,
"formatter": "",
"style": {
"color": "#666666",
"cursor": "default",
"fontSize": "11px"
},
"useHTML": false,
"step": 0
},
"plotBands": null,
"visible": true,
"floor": null,
"ceiling": null,
"type": "linear",
"min": 0,
"gridLineWidth": 1,
"gridLineColor": "#e6e6e6",
"minorTickInterval": null,
"minorTickWidth": 0,
"minTickInterval": null,
"startOnTick": true,
"endOnTick": true,
"tickmarkPlacement": 100,
"units": 100,
"minRange": 100
},
"yAxis": {
"title": {
"text": [
"Multi Score"
],
"useHTML": false,
"style": {
"color": "#666666"
}
},
"categories": null,
"plotLines": null,
"plotBands": null,
"lineWidth": null,
"tickInterval": null,
"tickLength": 10,
"floor": null,
"ceiling": null,
"gridLineInterpolation": null,
"gridLineWidth": 1,
"gridLineColor": "#e6e6e6",
"min": 0,
"max": null,
"minorTickInterval": null,
"minorTickWidth": 0,
"minTickInterval": null,
"startOnTick": true,
"endOnTick": true,
"minRange": null,
"type": "linear",
"tickmarkPlacement": null,
"labels": {
"enabled": true,
"formatter": null,
"style": {
"color": "#666666",
"cursor": "default",
"fontSize": "11px"
},
"useHTML": false
}
},
"zAxis": {
"title": {
"text": "Multi Score"
}
},
"plotOptions": {
"series": {
"dataLabels": {
"enabled": false,
"format": null,
"distance": 30,
"align": "center",
"inside": null,
"allowOverlap": false,
"style": {
"fontSize": "11px"
}
},
"showInLegend": null,
"turboThreshold": 0,
"stacking": "",
"groupPadding": 0.2,
"centerInCategory": false,
"findNearestPointBy": "x"
}
},
"navigator": {
"enabled": false
},
"scrollbar": {
"enabled": false
},
"rangeSelector": {
"enabled": false,
"inputEnabled": false
},
"legend": {
"enabled": null,
"maxHeight": null,
"align": "center",
"verticalAlign": "bottom",
"layout": "horizontal",
"width": null,
"margin": 12,
"reversed": false
},
"series": [
{
"name": "Standard_D2ds_v4 by Microsoft Azure",
"color": "#55b3ff",
"data": [
{
"x": 971.3962164169966,
"y": 1159.3726194942715
},
{
"x": 942.9298983969438,
"y": 1138.7099172610028
},
{
"x": 972.6114963160774,
"y": 1153.313072757646
},
{
"x": 941.6940304943176,
"y": 1133.0373248427102
},
{
"x": 974.7339755145251,
"y": 1160.1746275875576
},
{
"x": 948.2654737082423,
"y": 1141.3096780185906
},
{
"x": 974.6635687102439,
"y": 1138.3568706323572
},
{
"x": 944.4808174689672,
"y": 1141.4997754623425
},
{
"x": 965.0848147877048,
"y": 1159.7489778564577
},
{
"x": 943.4868659921367,
"y": 1135.5887320000545
},
{
"x": 969.3228030995328,
"y": 1152.804056674388
},
{
"x": 939.5339740918232,
"y": 1134.1642017332822
},
{
"x": 974.5135913712559,
"y": 1152.3157407809335
},
{
"x": 948.4226560754436,
"y": 1137.8855189454148
},
{
"x": 962.7231406802448,
"y": 1144.5097662768287
},
{
"x": 941.3381154409158,
"y": 1129.7361040182284
},
{
"x": 946.2866410915083,
"y": 1149.136874590396
},
{
"x": 940.0951951298797,
"y": 1135.0956698599218
},
{
"x": 965.8335816995719,
"y": 1154.2204713933997
},
{
"x": 945.6895024104585,
"y": 1131.4529186459836
},
{
"x": 955.9168713807514,
"y": 1134.7504463423259
},
{
"x": 927.766738369288,
"y": 1112.7649009908507
},
{
"x": 951.1612147792162,
"y": 1132.2794778570017
},
{
"x": 928.6138628079125,
"y": 1115.9649777308728
},
{
"x": 953.0301007544934,
"y": 1133.4345554116103
},
{
"x": 923.3475708146134,
"y": 1113.5187210626489
}
]
}
],
"drilldown": {},
"tooltip": {
"enabled": true,
"useHTML": false,
"format": null,
"headerFormat": "",
"pointFormat": "<span style=\"color:{series.color}\">Single</span>: <b>{point.x:.0f}</b><br><span style=\"color:{series.color}\">Multi</span>: <b>{point.y:.0f}</b>",
"footerFormat": "",
"shared": false,
"outside": false,
"valueDecimals": null,
"split": false
},
"annotations": null
},
"hc_type": "chart",
"id": "238447418841962123568553111873643484340"
}
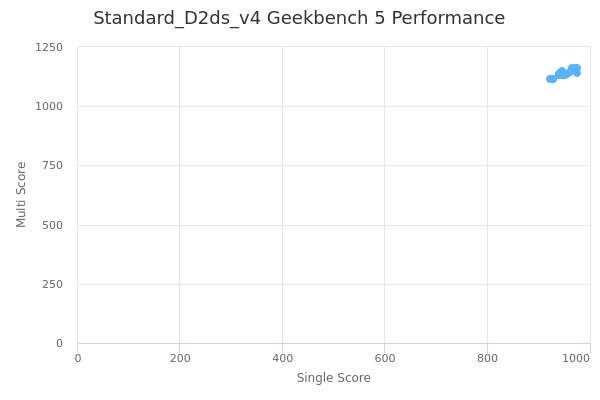
| Single | Multi | |
|---|---|---|
| Max | 975 | 1160 |
| Average | 952 | 1139 |
| Deviation | 15.08 | 13.05 |
| Min | 923 | 1113 |
Sign up as Freemium to get more insight.