Standard_D2d_v4 by Microsoft Azure
Geekbench is a cross-platform processor benchmark with a scoring system that determines single-core and multi-core performance using loads simulating real-world scenarios. Geekbench 5 score is calculated with a reference score of 2500 representing the performance of the Intel Core i5-2520M @ 2.50 GHz. The software benchmark is available for Mac OS, Windows, Linux, Android and iOS platforms.
Specifications:
CPU
2
RAM
8.0 GB
Extra
1x
75 GB
N/A
{
"configuration": {
"chart": {
"type": "scatter",
"polar": false,
"zoomType": "",
"options3d": {},
"height": null,
"width": null,
"margin": null,
"inverted": false,
"zooming": {}
},
"credits": {
"enabled": false
},
"title": {
"text": ""
},
"colorAxis": null,
"subtitle": {
"text": ""
},
"xAxis": {
"title": {
"text": [
"Single Score"
],
"useHTML": false,
"style": {
"color": "#666666"
}
},
"categories": null,
"lineWidth": 1,
"tickInterval": null,
"tickWidth": 1,
"tickLength": 10,
"tickPixelInterval": 100,
"plotLines": null,
"labels": {
"enabled": true,
"format": null,
"formatter": "",
"style": {
"color": "#666666",
"cursor": "default",
"fontSize": "11px"
},
"useHTML": false,
"step": 0
},
"plotBands": null,
"visible": true,
"floor": null,
"ceiling": null,
"type": "linear",
"min": 0,
"gridLineWidth": 1,
"gridLineColor": "#e6e6e6",
"minorTickInterval": null,
"minorTickWidth": 0,
"minTickInterval": null,
"startOnTick": true,
"endOnTick": true,
"tickmarkPlacement": 100,
"units": 100,
"minRange": 100
},
"yAxis": {
"title": {
"text": [
"Multi Score"
],
"useHTML": false,
"style": {
"color": "#666666"
}
},
"categories": null,
"plotLines": null,
"plotBands": null,
"lineWidth": null,
"tickInterval": null,
"tickLength": 10,
"floor": null,
"ceiling": null,
"gridLineInterpolation": null,
"gridLineWidth": 1,
"gridLineColor": "#e6e6e6",
"min": 0,
"max": null,
"minorTickInterval": null,
"minorTickWidth": 0,
"minTickInterval": null,
"startOnTick": true,
"endOnTick": true,
"minRange": null,
"type": "linear",
"tickmarkPlacement": null,
"labels": {
"enabled": true,
"formatter": null,
"style": {
"color": "#666666",
"cursor": "default",
"fontSize": "11px"
},
"useHTML": false
}
},
"zAxis": {
"title": {
"text": "Multi Score"
}
},
"plotOptions": {
"series": {
"dataLabels": {
"enabled": false,
"format": null,
"distance": 30,
"align": "center",
"inside": null,
"allowOverlap": false,
"style": {
"fontSize": "11px"
}
},
"showInLegend": null,
"turboThreshold": 0,
"stacking": "",
"groupPadding": 0.2,
"centerInCategory": false,
"findNearestPointBy": "x"
}
},
"navigator": {
"enabled": false
},
"scrollbar": {
"enabled": false
},
"rangeSelector": {
"enabled": false,
"inputEnabled": false
},
"legend": {
"enabled": null,
"maxHeight": null,
"align": "center",
"verticalAlign": "bottom",
"layout": "horizontal",
"width": null,
"margin": 12,
"reversed": false
},
"series": [
{
"name": "Standard_D2d_v4 by Microsoft Azure",
"color": "#55b3ff",
"data": [
{
"x": 952.0070633659032,
"y": 1141.0171410025587
},
{
"x": 937.3097616403084,
"y": 1132.620007955506
},
{
"x": 948.0696131642225,
"y": 1136.701249541829
},
{
"x": 943.7761679918808,
"y": 1131.6519403639368
},
{
"x": 943.8770540812898,
"y": 1133.877039558771
},
{
"x": 938.227877644554,
"y": 1129.440305091786
},
{
"x": 951.8429996497017,
"y": 1143.7629092720906
},
{
"x": 942.1717388537356,
"y": 1130.8272399206235
},
{
"x": 952.0049952485601,
"y": 1141.817744149872
},
{
"x": 941.0935401658398,
"y": 1121.0289842158882
},
{
"x": 948.8023799402667,
"y": 1138.4561675732762
},
{
"x": 928.969066941103,
"y": 1132.2313376186205
},
{
"x": 951.2518914094046,
"y": 1138.1392797644282
},
{
"x": 931.0815468668847,
"y": 1126.4791434547906
},
{
"x": 951.743550956614,
"y": 1142.8737796089022
},
{
"x": 934.5036626673023,
"y": 1132.5998884723474
},
{
"x": 952.2274495952306,
"y": 1135.2189929861818
},
{
"x": 938.660018624322,
"y": 1128.17710431909
},
{
"x": 944.8237635666242,
"y": 1137.1477907747635
},
{
"x": 937.0114596608485,
"y": 1125.6439994629898
}
]
}
],
"drilldown": {},
"tooltip": {
"enabled": true,
"useHTML": false,
"format": null,
"headerFormat": "",
"pointFormat": "<span style=\"color:{series.color}\">Single</span>: <b>{point.x:.0f}</b><br><span style=\"color:{series.color}\">Multi</span>: <b>{point.y:.0f}</b>",
"footerFormat": "",
"shared": false,
"outside": false,
"valueDecimals": null,
"split": false
},
"annotations": null
},
"hc_type": "chart",
"id": "205468473420131565700959128225484776269"
}
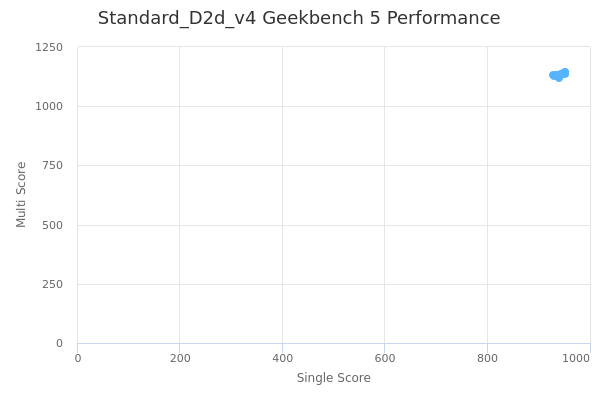
| Single | Multi | |
|---|---|---|
| Max | 952 | 1144 |
| Average | 943 | 1134 |
| Deviation | 7.26 | 5.97 |
| Min | 929 | 1121 |
Sign up as Freemium to get more insight.