Standard_D2_v5 by Microsoft Azure
Geekbench is a cross-platform processor benchmark with a scoring system that determines single-core and multi-core performance using loads simulating real-world scenarios. Geekbench 5 score is calculated with a reference score of 2500 representing the performance of the Intel Core i5-2520M @ 2.50 GHz. The software benchmark is available for Mac OS, Windows, Linux, Android and iOS platforms.
Specifications:
CPU
2
RAM
8.0 GB
{
"configuration": {
"chart": {
"type": "scatter",
"polar": false,
"zoomType": "",
"options3d": {},
"height": null,
"width": null,
"margin": null,
"inverted": false,
"zooming": {}
},
"credits": {
"enabled": false
},
"title": {
"text": ""
},
"colorAxis": null,
"subtitle": {
"text": ""
},
"xAxis": {
"title": {
"text": [
"Single Score"
],
"useHTML": false,
"style": {
"color": "#666666"
}
},
"categories": null,
"lineWidth": 1,
"tickInterval": null,
"tickWidth": 1,
"tickLength": 10,
"tickPixelInterval": 100,
"plotLines": null,
"labels": {
"enabled": true,
"format": null,
"formatter": "",
"style": {
"color": "#666666",
"cursor": "default",
"fontSize": "11px"
},
"useHTML": false,
"step": 0
},
"plotBands": null,
"visible": true,
"floor": null,
"ceiling": null,
"type": "linear",
"min": 0,
"gridLineWidth": 1,
"gridLineColor": "#e6e6e6",
"minorTickInterval": null,
"minorTickWidth": 0,
"minTickInterval": null,
"startOnTick": true,
"endOnTick": true,
"tickmarkPlacement": 100,
"units": 100,
"minRange": 100
},
"yAxis": {
"title": {
"text": [
"Multi Score"
],
"useHTML": false,
"style": {
"color": "#666666"
}
},
"categories": null,
"plotLines": null,
"plotBands": null,
"lineWidth": null,
"tickInterval": null,
"tickLength": 10,
"floor": null,
"ceiling": null,
"gridLineInterpolation": null,
"gridLineWidth": 1,
"gridLineColor": "#e6e6e6",
"min": 0,
"max": null,
"minorTickInterval": null,
"minorTickWidth": 0,
"minTickInterval": null,
"startOnTick": true,
"endOnTick": true,
"minRange": null,
"type": "linear",
"tickmarkPlacement": null,
"labels": {
"enabled": true,
"formatter": null,
"style": {
"color": "#666666",
"cursor": "default",
"fontSize": "11px"
},
"useHTML": false
}
},
"zAxis": {
"title": {
"text": "Multi Score"
}
},
"plotOptions": {
"series": {
"dataLabels": {
"enabled": false,
"format": null,
"distance": 30,
"align": "center",
"inside": null,
"allowOverlap": false,
"style": {
"fontSize": "11px"
}
},
"showInLegend": null,
"turboThreshold": 0,
"stacking": "",
"groupPadding": 0.2,
"centerInCategory": false,
"findNearestPointBy": "x"
}
},
"navigator": {
"enabled": false
},
"scrollbar": {
"enabled": false
},
"rangeSelector": {
"enabled": false,
"inputEnabled": false
},
"legend": {
"enabled": null,
"maxHeight": null,
"align": "center",
"verticalAlign": "bottom",
"layout": "horizontal",
"width": null,
"margin": 12,
"reversed": false
},
"series": [
{
"name": "Standard_D2_v5 by Microsoft Azure",
"color": "#55b3ff",
"data": [
{
"x": 1243.9903604639258,
"y": 1461.9968749007428
},
{
"x": 1223.180405102798,
"y": 1450.1798076473985
},
{
"x": 1233.8398483412777,
"y": 1471.08441276749
},
{
"x": 1212.7792315718752,
"y": 1456.9385867486149
},
{
"x": 1237.2895511534466,
"y": 1465.8072137068814
},
{
"x": 1224.8481656193226,
"y": 1465.1580947016528
},
{
"x": 1229.9083969972244,
"y": 1458.1465254449547
},
{
"x": 1229.7567941291436,
"y": 1460.1256702019732
},
{
"x": 1228.053729437372,
"y": 1458.2717792463077
},
{
"x": 1221.0701198253025,
"y": 1461.1169762868394
},
{
"x": 1225.6596495447834,
"y": 1464.145602784818
},
{
"x": 1229.8309978102966,
"y": 1445.8542324721734
},
{
"x": 1241.4929501019615,
"y": 1472.9863764838217
},
{
"x": 1222.5806338335665,
"y": 1458.9153272903336
},
{
"x": 1244.0134905711775,
"y": 1456.8637796224587
},
{
"x": 1224.098277511798,
"y": 1448.5286484548785
},
{
"x": 1236.1533011774075,
"y": 1468.1314285907674
},
{
"x": 1223.0472577385729,
"y": 1456.6265723315391
},
{
"x": 1241.2407103746275,
"y": 1466.4021977712987
},
{
"x": 1229.8039295585904,
"y": 1453.4465733620598
}
]
}
],
"drilldown": {},
"tooltip": {
"enabled": true,
"useHTML": false,
"format": null,
"headerFormat": "",
"pointFormat": "<span style=\"color:{series.color}\">Single</span>: <b>{point.x:.0f}</b><br><span style=\"color:{series.color}\">Multi</span>: <b>{point.y:.0f}</b>",
"footerFormat": "",
"shared": false,
"outside": false,
"valueDecimals": null,
"split": false
},
"annotations": null
},
"hc_type": "chart",
"id": "75019292617059766393123586712206948875"
}
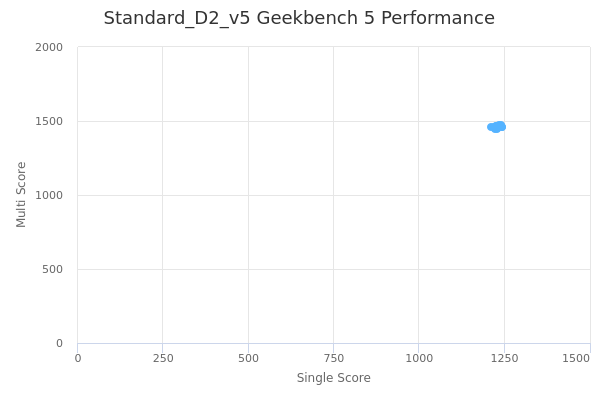
| Single | Multi | |
|---|---|---|
| Max | 1244 | 1473 |
| Average | 1230 | 1460 |
| Deviation | 8.27 | 7.04 |
| Min | 1213 | 1446 |
Sign up as Freemium to get more insight.