Standard_D16s_v5 by Microsoft Azure
Geekbench is a cross-platform processor benchmark with a scoring system that determines single-core and multi-core performance using loads simulating real-world scenarios. Geekbench 5 score is calculated with a reference score of 2500 representing the performance of the Intel Core i5-2520M @ 2.50 GHz. The software benchmark is available for Mac OS, Windows, Linux, Android and iOS platforms.
Specifications:
CPU
16
RAM
64.0 GB
{
"configuration": {
"chart": {
"type": "scatter",
"polar": false,
"zoomType": "",
"options3d": {},
"height": null,
"width": null,
"margin": null,
"inverted": false,
"zooming": {}
},
"credits": {
"enabled": false
},
"title": {
"text": ""
},
"colorAxis": null,
"subtitle": {
"text": ""
},
"xAxis": {
"title": {
"text": [
"Single Score"
],
"useHTML": false,
"style": {
"color": "#666666"
}
},
"categories": null,
"lineWidth": 1,
"tickInterval": null,
"tickWidth": 1,
"tickLength": 10,
"tickPixelInterval": 100,
"plotLines": null,
"labels": {
"enabled": true,
"format": null,
"formatter": "",
"style": {
"color": "#666666",
"cursor": "default",
"fontSize": "11px"
},
"useHTML": false,
"step": 0
},
"plotBands": null,
"visible": true,
"floor": null,
"ceiling": null,
"type": "linear",
"min": 0,
"gridLineWidth": 1,
"gridLineColor": "#e6e6e6",
"minorTickInterval": null,
"minorTickWidth": 0,
"minTickInterval": null,
"startOnTick": true,
"endOnTick": true,
"tickmarkPlacement": 100,
"units": 100,
"minRange": 100
},
"yAxis": {
"title": {
"text": [
"Multi Score"
],
"useHTML": false,
"style": {
"color": "#666666"
}
},
"categories": null,
"plotLines": null,
"plotBands": null,
"lineWidth": null,
"tickInterval": null,
"tickLength": 10,
"floor": null,
"ceiling": null,
"gridLineInterpolation": null,
"gridLineWidth": 1,
"gridLineColor": "#e6e6e6",
"min": 0,
"max": null,
"minorTickInterval": null,
"minorTickWidth": 0,
"minTickInterval": null,
"startOnTick": true,
"endOnTick": true,
"minRange": null,
"type": "linear",
"tickmarkPlacement": null,
"labels": {
"enabled": true,
"formatter": null,
"style": {
"color": "#666666",
"cursor": "default",
"fontSize": "11px"
},
"useHTML": false
}
},
"zAxis": {
"title": {
"text": "Multi Score"
}
},
"plotOptions": {
"series": {
"dataLabels": {
"enabled": false,
"format": null,
"distance": 30,
"align": "center",
"inside": null,
"allowOverlap": false,
"style": {
"fontSize": "11px"
}
},
"showInLegend": null,
"turboThreshold": 0,
"stacking": "",
"groupPadding": 0.2,
"centerInCategory": false,
"findNearestPointBy": "x"
}
},
"navigator": {
"enabled": false
},
"scrollbar": {
"enabled": false
},
"rangeSelector": {
"enabled": false,
"inputEnabled": false
},
"legend": {
"enabled": null,
"maxHeight": null,
"align": "center",
"verticalAlign": "bottom",
"layout": "horizontal",
"width": null,
"margin": 12,
"reversed": false
},
"series": [
{
"name": "Standard_D16s_v5 by Microsoft Azure",
"color": "#55b3ff",
"data": [
{
"x": 1249.5810343896223,
"y": 10249.68419828759
},
{
"x": 1262.4976544759454,
"y": 10453.78491987388
},
{
"x": 1235.7592641392193,
"y": 10392.864899337648
},
{
"x": 1264.5253842529705,
"y": 10429.260926632604
},
{
"x": 1222.6940279095193,
"y": 10357.102647046275
},
{
"x": 1251.88616431319,
"y": 10446.775560181175
},
{
"x": 1251.3655893642094,
"y": 10408.045924963651
},
{
"x": 1251.664914568254,
"y": 10266.883334399217
},
{
"x": 1258.3061646855112,
"y": 10468.181907741271
},
{
"x": 1228.6323325391731,
"y": 10317.218205741885
},
{
"x": 1247.3729929237495,
"y": 10403.068696879152
},
{
"x": 1241.691811083409,
"y": 10376.804997427738
},
{
"x": 1257.7487563769307,
"y": 10495.042078384555
},
{
"x": 1221.3333302061603,
"y": 10311.24378373078
},
{
"x": 1257.910116993547,
"y": 10482.022027521103
},
{
"x": 1239.5878591765152,
"y": 10216.392388412656
},
{
"x": 1269.7140810422216,
"y": 10484.715477882775
},
{
"x": 1215.6422980014338,
"y": 10337.599783307625
},
{
"x": 1256.0720357955333,
"y": 10449.519297774541
},
{
"x": 1211.6601439858564,
"y": 10336.482390746674
},
{
"x": 1249.2068329901454,
"y": 10246.429430680493
},
{
"x": 1218.7179688498602,
"y": 10442.582463509842
},
{
"x": 1260.7968067514541,
"y": 10195.562414570799
},
{
"x": 1250.7155794754476,
"y": 10431.769265628169
},
{
"x": 1244.953301268943,
"y": 10214.626704653216
},
{
"x": 1236.7155693054,
"y": 10409.758246723291
},
{
"x": 1244.990532711443,
"y": 10277.77623692427
},
{
"x": 1244.2372401890816,
"y": 10386.407597415078
},
{
"x": 1250.7895550493172,
"y": 10267.51276144646
},
{
"x": 1245.3477791105531,
"y": 10394.975439588075
},
{
"x": 1246.747657692741,
"y": 10256.797533949026
},
{
"x": 1247.4918836769596,
"y": 10407.689728369569
},
{
"x": 1254.3574541259377,
"y": 10276.105252344718
},
{
"x": 1249.4495200065076,
"y": 10362.02014445158
},
{
"x": 1257.9944622780226,
"y": 10267.655985185813
},
{
"x": 1246.8846942972777,
"y": 10442.114967540962
},
{
"x": 1250.5569235672704,
"y": 10259.572521893057
},
{
"x": 1245.4605723220363,
"y": 10426.233384275885
},
{
"x": 1248.2343583215707,
"y": 10241.073519657932
},
{
"x": 1240.5998107371322,
"y": 10356.216627257707
},
{
"x": 1168.3485283354194,
"y": 10138.183655569957
},
{
"x": 1194.06845221409,
"y": 10004.15847615371
},
{
"x": 1270.065511552811,
"y": 10216.027830787849
},
{
"x": 1199.7435352884381,
"y": 10135.795004396407
},
{
"x": 1232.5867179627714,
"y": 10270.214789224628
},
{
"x": 1190.9071656867382,
"y": 9940.221137538636
},
{
"x": 1279.8155142742291,
"y": 10327.081815401201
},
{
"x": 1253.7739145967396,
"y": 10319.043635969512
},
{
"x": 1258.5893658446073,
"y": 10327.790812444688
},
{
"x": 1271.1164661791393,
"y": 10310.685463417482
}
]
}
],
"drilldown": {},
"tooltip": {
"enabled": true,
"useHTML": false,
"format": null,
"headerFormat": "",
"pointFormat": "<span style=\"color:{series.color}\">Single</span>: <b>{point.x:.0f}</b><br><span style=\"color:{series.color}\">Multi</span>: <b>{point.y:.0f}</b>",
"footerFormat": "",
"shared": false,
"outside": false,
"valueDecimals": null,
"split": false
},
"annotations": null
},
"hc_type": "chart",
"id": "155831458139326786973087511148530228625"
}
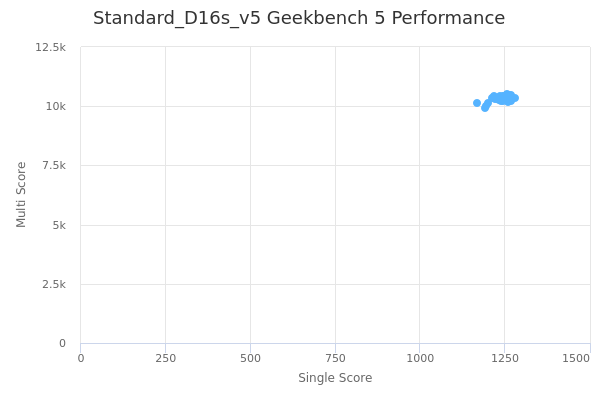
| Single | Multi | |
|---|---|---|
| Max | 1280 | 10495 |
| Average | 1243 | 10325 |
| Deviation | 21.51 | 116.05 |
| Min | 1168 | 9940 |
Sign up as Freemium to get more insight.