Linux Xlarge 2.0 by Amazon Web Services
Geekbench is a cross-platform processor benchmark with a scoring system that determines single-core and multi-core performance using loads simulating real-world scenarios. Geekbench 5 score is calculated with a reference score of 2500 representing the performance of the Intel Core i5-2520M @ 2.50 GHz. The software benchmark is available for Mac OS, Windows, Linux, Android and iOS platforms.
Specifications:
CPU
4
RAM
16.0 GB
Root
320 GB
Lightsail root
{
"configuration": {
"chart": {
"type": "scatter",
"polar": false,
"zoomType": "",
"options3d": {},
"height": null,
"width": null,
"margin": null,
"inverted": false,
"zooming": {}
},
"credits": {
"enabled": false
},
"title": {
"text": ""
},
"colorAxis": null,
"subtitle": {
"text": ""
},
"xAxis": {
"title": {
"text": [
"Single Score"
],
"useHTML": false,
"style": {
"color": "#666666"
}
},
"categories": null,
"lineWidth": 1,
"tickInterval": null,
"tickWidth": 1,
"tickLength": 10,
"tickPixelInterval": 100,
"plotLines": null,
"labels": {
"enabled": true,
"format": null,
"formatter": "",
"style": {
"color": "#666666",
"cursor": "default",
"fontSize": "11px"
},
"useHTML": false,
"step": 0
},
"plotBands": null,
"visible": true,
"floor": null,
"ceiling": null,
"type": "linear",
"min": 0,
"gridLineWidth": 1,
"gridLineColor": "#e6e6e6",
"minorTickInterval": null,
"minorTickWidth": 0,
"minTickInterval": null,
"startOnTick": true,
"endOnTick": true,
"tickmarkPlacement": 100,
"units": 100,
"minRange": 100
},
"yAxis": {
"title": {
"text": [
"Multi Score"
],
"useHTML": false,
"style": {
"color": "#666666"
}
},
"categories": null,
"plotLines": null,
"plotBands": null,
"lineWidth": null,
"tickInterval": null,
"tickLength": 10,
"floor": null,
"ceiling": null,
"gridLineInterpolation": null,
"gridLineWidth": 1,
"gridLineColor": "#e6e6e6",
"min": 0,
"max": null,
"minorTickInterval": null,
"minorTickWidth": 0,
"minTickInterval": null,
"startOnTick": true,
"endOnTick": true,
"minRange": null,
"type": "linear",
"tickmarkPlacement": null,
"labels": {
"enabled": true,
"formatter": null,
"style": {
"color": "#666666",
"cursor": "default",
"fontSize": "11px"
},
"useHTML": false
}
},
"zAxis": {
"title": {
"text": "Multi Score"
}
},
"plotOptions": {
"series": {
"dataLabels": {
"enabled": false,
"format": null,
"distance": 30,
"align": "center",
"inside": null,
"allowOverlap": false,
"style": {
"fontSize": "11px"
}
},
"showInLegend": null,
"turboThreshold": 0,
"stacking": "",
"groupPadding": 0.2,
"centerInCategory": false,
"findNearestPointBy": "x"
}
},
"navigator": {
"enabled": false
},
"scrollbar": {
"enabled": false
},
"rangeSelector": {
"enabled": false,
"inputEnabled": false
},
"legend": {
"enabled": null,
"maxHeight": null,
"align": "center",
"verticalAlign": "bottom",
"layout": "horizontal",
"width": null,
"margin": 12,
"reversed": false
},
"series": [
{
"name": "Linux Xlarge 2.0 by Amazon Web Services",
"color": "#f7981d",
"data": [
{
"x": 703.5235932951464,
"y": 2728.7921315742196
},
{
"x": 704.8538331306942,
"y": 2727.638265691326
},
{
"x": 701.2212755905514,
"y": 2721.7290656326186
},
{
"x": 724.3332275609899,
"y": 2783.2199590758883
},
{
"x": 687.035148957341,
"y": 2619.269455716541
},
{
"x": 725.9013275934878,
"y": 2793.12835736213
},
{
"x": 693.9048596657476,
"y": 2637.144288598479
},
{
"x": 724.1062745075335,
"y": 2775.5148410088877
},
{
"x": 686.0820170080708,
"y": 2640.21362529553
},
{
"x": 722.1743684734397,
"y": 2793.444783741138
},
{
"x": 692.5636901716019,
"y": 2638.197439904828
},
{
"x": 726.04264802084,
"y": 2785.496922221657
},
{
"x": 693.8254961127793,
"y": 2650.437771134445
},
{
"x": 724.8955480744964,
"y": 2775.7893027674886
},
{
"x": 691.6661912945539,
"y": 2645.322050184431
},
{
"x": 725.4212006154564,
"y": 2787.875365807797
},
{
"x": 691.225954133702,
"y": 2655.2554108141167
},
{
"x": 724.5498274778722,
"y": 2788.621302062853
},
{
"x": 699.5776006278693,
"y": 2658.4020711340854
},
{
"x": 722.4086421209421,
"y": 2793.8752655797343
},
{
"x": 696.3623538049147,
"y": 2646.12806082128
},
{
"x": 724.1510068590885,
"y": 2802.510417892433
},
{
"x": 697.4344317598677,
"y": 2643.6727739740045
}
]
}
],
"drilldown": {},
"tooltip": {
"enabled": true,
"useHTML": false,
"format": null,
"headerFormat": "",
"pointFormat": "<span style=\"color:{series.color}\">Single</span>: <b>{point.x:.0f}</b><br><span style=\"color:{series.color}\">Multi</span>: <b>{point.y:.0f}</b>",
"footerFormat": "",
"shared": false,
"outside": false,
"valueDecimals": null,
"split": false
},
"annotations": null
},
"hc_type": "chart",
"id": "174881706971048660771533860891085684450"
}
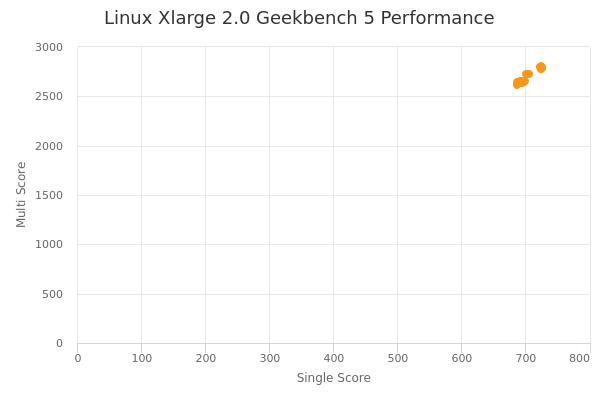
| Single | Multi | |
|---|---|---|
| Max | 726 | 2803 |
| Average | 708 | 2717 |
| Deviation | 15.04 | 68.05 |
| Min | 686 | 2619 |
Sign up as Freemium to get more insight.
- In same series
- Linux Nano 2.0
- Linux Nano 2.1
- Linux Nano 2.2
- Windows Nano 2.0
- Windows Nano 2.1
- Windows Nano 2.2
- Linux Micro 2.0
- Linux Micro 2.1
- Linux Micro 2.2
- Windows Micro 2.0
- Windows Micro 2.1
- Windows Micro 2.2
- Linux Small 2.0
- Linux Small 2.1
- Linux Small 2.2
- Windows Small 2.0
- Windows Small 2.1
- Windows Small 2.2
- Linux Nano 2.3
- Windows Nano 2.3
- Linux Micro 2.3
- Windows Micro 2.3
- Linux Small 2.3
- Windows Small 2.3
- Linux Medium
- Linux Medium 2.0
- Linux Medium 2.1
- Linux Medium 2.2
- Linux Medium 2.3
- Windows Medium 2.0
- Windows Medium 2.1
- Windows Medium 2.2
- Windows Medium 2.3
- Linux Large 2.0
- Linux Large 2.1
- Linux Large 2.2
- Linux Large 2.3
- Windows Large 2.0
- Windows Large 2.1
- Windows Large 2.2
- Windows Large 2.3
- Linux Xlarge 2.0
- Linux Xlarge 2.1
- Linux Xlarge 2.2
- Linux Xlarge 2.3
- Windows Xlarge 2.0
- Windows Xlarge 2.1
- Windows Xlarge 2.2
- Windows Xlarge 2.3
- Linux 2Xlarge 2.0
- Linux 2Xlarge 2.1
- Linux 2Xlarge 2.2
- Linux 2Xlarge 2.3
- Windows 2Xlarge 2.0
- Windows 2Xlarge 2.1
- Windows 2Xlarge 2.2
- Windows 2Xlarge 2.3