x1e.xlarge by Amazon Web Services
Geekbench is a cross-platform processor benchmark with a scoring system that determines single-core and multi-core performance using loads simulating real-world scenarios. Geekbench 5 score is calculated with a reference score of 2500 representing the performance of the Intel Core i5-2520M @ 2.50 GHz. The software benchmark is available for Mac OS, Windows, Linux, Android and iOS platforms.
Specifications:
CPU
4
RAM
122.0 GB
Extra
1x
120 GB
SSD
Net
10000 Mbps
{
"configuration": {
"chart": {
"type": "scatter",
"polar": false,
"zoomType": "",
"options3d": {},
"height": null,
"width": null,
"margin": null,
"inverted": false,
"zooming": {}
},
"credits": {
"enabled": false
},
"title": {
"text": ""
},
"colorAxis": null,
"subtitle": {
"text": ""
},
"xAxis": {
"title": {
"text": [
"Single Score"
],
"useHTML": false,
"style": {
"color": "#666666"
}
},
"categories": null,
"lineWidth": 1,
"tickInterval": null,
"tickWidth": 1,
"tickLength": 10,
"tickPixelInterval": 100,
"plotLines": null,
"labels": {
"enabled": true,
"format": null,
"formatter": "",
"style": {
"color": "#666666",
"cursor": "default",
"fontSize": "11px"
},
"useHTML": false,
"step": 0
},
"plotBands": null,
"visible": true,
"floor": null,
"ceiling": null,
"type": "linear",
"min": 0,
"gridLineWidth": 1,
"gridLineColor": "#e6e6e6",
"minorTickInterval": null,
"minorTickWidth": 0,
"minTickInterval": null,
"startOnTick": true,
"endOnTick": true,
"tickmarkPlacement": 100,
"units": 100,
"minRange": 100
},
"yAxis": {
"title": {
"text": [
"Multi Score"
],
"useHTML": false,
"style": {
"color": "#666666"
}
},
"categories": null,
"plotLines": null,
"plotBands": null,
"lineWidth": null,
"tickInterval": null,
"tickLength": 10,
"floor": null,
"ceiling": null,
"gridLineInterpolation": null,
"gridLineWidth": 1,
"gridLineColor": "#e6e6e6",
"min": 0,
"max": null,
"minorTickInterval": null,
"minorTickWidth": 0,
"minTickInterval": null,
"startOnTick": true,
"endOnTick": true,
"minRange": null,
"type": "linear",
"tickmarkPlacement": null,
"labels": {
"enabled": true,
"formatter": null,
"style": {
"color": "#666666",
"cursor": "default",
"fontSize": "11px"
},
"useHTML": false
}
},
"zAxis": {
"title": {
"text": "Multi Score"
}
},
"plotOptions": {
"series": {
"dataLabels": {
"enabled": false,
"format": null,
"distance": 30,
"align": "center",
"inside": null,
"allowOverlap": false,
"style": {
"fontSize": "11px"
}
},
"showInLegend": null,
"turboThreshold": 0,
"stacking": "",
"groupPadding": 0.2,
"centerInCategory": false,
"findNearestPointBy": "x"
}
},
"navigator": {
"enabled": false
},
"scrollbar": {
"enabled": false
},
"rangeSelector": {
"enabled": false,
"inputEnabled": false
},
"legend": {
"enabled": null,
"maxHeight": null,
"align": "center",
"verticalAlign": "bottom",
"layout": "horizontal",
"width": null,
"margin": 12,
"reversed": false
},
"series": [
{
"name": "x1e.xlarge by Amazon Web Services",
"color": "#f7981d",
"data": [
{
"x": 686.8582065823712,
"y": 1595.2557189049735
},
{
"x": 692.7571716468799,
"y": 1589.4843611579809
},
{
"x": 685.1131947959682,
"y": 1594.991367694945
},
{
"x": 682.4536595750938,
"y": 1590.4154219649588
},
{
"x": 686.110959372234,
"y": 1590.2226617168558
},
{
"x": 690.2361641176934,
"y": 1591.251940388328
},
{
"x": 689.3810270580672,
"y": 1597.5218314997737
},
{
"x": 682.418587598318,
"y": 1592.3252869340288
},
{
"x": 684.6861603325259,
"y": 1597.149876098371
},
{
"x": 689.4703208819694,
"y": 1591.865658431846
},
{
"x": 691.6659029931213,
"y": 1598.4570483648597
},
{
"x": 682.5105242549537,
"y": 1586.2177607588817
},
{
"x": 690.2667819973894,
"y": 1596.7525185915397
},
{
"x": 682.9054737607937,
"y": 1594.192168602342
},
{
"x": 684.6939769821255,
"y": 1591.4839766034947
},
{
"x": 689.1520909718555,
"y": 1588.7185109103223
},
{
"x": 683.0628128022082,
"y": 1595.248635545184
},
{
"x": 683.266870219578,
"y": 1590.890319398649
},
{
"x": 685.9761131317105,
"y": 1591.5951308454873
},
{
"x": 682.1584005105342,
"y": 1592.9696929644933
}
]
}
],
"drilldown": {},
"tooltip": {
"enabled": true,
"useHTML": false,
"format": null,
"headerFormat": "",
"pointFormat": "<span style=\"color:{series.color}\">Single</span>: <b>{point.x:.0f}</b><br><span style=\"color:{series.color}\">Multi</span>: <b>{point.y:.0f}</b>",
"footerFormat": "",
"shared": false,
"outside": false,
"valueDecimals": null,
"split": false
},
"annotations": null
},
"hc_type": "chart",
"id": "145606226622867110769558150525527001262"
}
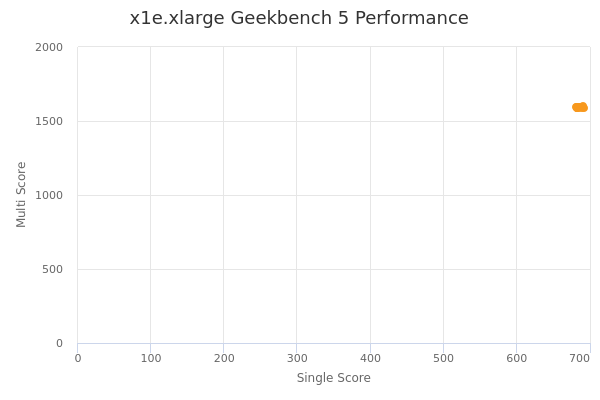
| Single | Multi | |
|---|---|---|
| Max | 693 | 1598 |
| Average | 686 | 1593 |
| Deviation | 3.38 | 3.17 |
| Min | 682 | 1586 |
Sign up as Freemium to get more insight.
- In same series
- x1e.xlarge
- x1e.2xlarge
- x1e.4xlarge
- x1e.8xlarge
- x1e.16xlarge
- x1e.32xlarge