t2.2xlarge by Amazon Web Services
Geekbench is a cross-platform processor benchmark with a scoring system that determines single-core and multi-core performance using loads simulating real-world scenarios. Geekbench 5 score is calculated with a reference score of 2500 representing the performance of the Intel Core i5-2520M @ 2.50 GHz. The software benchmark is available for Mac OS, Windows, Linux, Android and iOS platforms.
Specifications:
CPU
8
RAM
32.0 GB
{
"configuration": {
"chart": {
"type": "scatter",
"polar": false,
"zoomType": "",
"options3d": {},
"height": null,
"width": null,
"margin": null,
"inverted": false,
"zooming": {}
},
"credits": {
"enabled": false
},
"title": {
"text": ""
},
"colorAxis": null,
"subtitle": {
"text": ""
},
"xAxis": {
"title": {
"text": [
"Single Score"
],
"useHTML": false,
"style": {
"color": "#666666"
}
},
"categories": null,
"lineWidth": 1,
"tickInterval": null,
"tickWidth": 1,
"tickLength": 10,
"tickPixelInterval": 100,
"plotLines": null,
"labels": {
"enabled": true,
"format": null,
"formatter": "",
"style": {
"color": "#666666",
"cursor": "default",
"fontSize": "11px"
},
"useHTML": false,
"step": 0
},
"plotBands": null,
"visible": true,
"floor": null,
"ceiling": null,
"type": "linear",
"min": 0,
"gridLineWidth": 1,
"gridLineColor": "#e6e6e6",
"minorTickInterval": null,
"minorTickWidth": 0,
"minTickInterval": null,
"startOnTick": true,
"endOnTick": true,
"tickmarkPlacement": 100,
"units": 100,
"minRange": 100
},
"yAxis": {
"title": {
"text": [
"Multi Score"
],
"useHTML": false,
"style": {
"color": "#666666"
}
},
"categories": null,
"plotLines": null,
"plotBands": null,
"lineWidth": null,
"tickInterval": null,
"tickLength": 10,
"floor": null,
"ceiling": null,
"gridLineInterpolation": null,
"gridLineWidth": 1,
"gridLineColor": "#e6e6e6",
"min": 0,
"max": null,
"minorTickInterval": null,
"minorTickWidth": 0,
"minTickInterval": null,
"startOnTick": true,
"endOnTick": true,
"minRange": null,
"type": "linear",
"tickmarkPlacement": null,
"labels": {
"enabled": true,
"formatter": null,
"style": {
"color": "#666666",
"cursor": "default",
"fontSize": "11px"
},
"useHTML": false
}
},
"zAxis": {
"title": {
"text": "Multi Score"
}
},
"plotOptions": {
"series": {
"dataLabels": {
"enabled": false,
"format": null,
"distance": 30,
"align": "center",
"inside": null,
"allowOverlap": false,
"style": {
"fontSize": "11px"
}
},
"showInLegend": null,
"turboThreshold": 0,
"stacking": "",
"groupPadding": 0.2,
"centerInCategory": false,
"findNearestPointBy": "x"
}
},
"navigator": {
"enabled": false
},
"scrollbar": {
"enabled": false
},
"rangeSelector": {
"enabled": false,
"inputEnabled": false
},
"legend": {
"enabled": null,
"maxHeight": null,
"align": "center",
"verticalAlign": "bottom",
"layout": "horizontal",
"width": null,
"margin": 12,
"reversed": false
},
"series": [
{
"name": "t2.2xlarge by Amazon Web Services",
"color": "#f7981d",
"data": [
{
"x": 711.9535732382551,
"y": 5284.611427214583
},
{
"x": 714.9362163266183,
"y": 5299.3865432155
},
{
"x": 711.9306414505268,
"y": 5300.094040831061
},
{
"x": 719.4440697551174,
"y": 5294.047570968874
},
{
"x": 720.4784185880715,
"y": 5256.403977978716
},
{
"x": 724.0052520904969,
"y": 1837.6047076391774
},
{
"x": 724.8156279956338,
"y": 1759.1640910943781
},
{
"x": 724.9103807486999,
"y": 1615.2984645954364
},
{
"x": 726.7880858976824,
"y": 1145.40430508562
},
{
"x": 729.0126966007164,
"y": 2216.8640261797677
},
{
"x": 724.4966849051307,
"y": 1576.332317571213
},
{
"x": 725.0600049548968,
"y": 3911.939020665474
},
{
"x": 733.6092114047475,
"y": 3038.488057298805
},
{
"x": 726.4023292278835,
"y": 4075.14266620218
},
{
"x": 721.7584216940036,
"y": 4236.939969285475
},
{
"x": 724.5305655724845,
"y": 2246.1753101868358
},
{
"x": 723.0121426307257,
"y": 3792.2098665643657
},
{
"x": 719.0763073067974,
"y": 1216.4430194949437
},
{
"x": 728.2243484580471,
"y": 1997.5910263197168
},
{
"x": 726.6218544252354,
"y": 1513.1003188374282
},
{
"x": 724.9735314727918,
"y": 1191.7309723719463
},
{
"x": 726.3653132287945,
"y": 2636.564490608639
},
{
"x": 733.3481489583115,
"y": 1566.6150520348654
},
{
"x": 726.5165583575751,
"y": 4191.220555692743
},
{
"x": 728.2864437420969,
"y": 2779.042158964984
}
]
}
],
"drilldown": {},
"tooltip": {
"enabled": true,
"useHTML": false,
"format": null,
"headerFormat": "",
"pointFormat": "<span style=\"color:{series.color}\">Single</span>: <b>{point.x:.0f}</b><br><span style=\"color:{series.color}\">Multi</span>: <b>{point.y:.0f}</b>",
"footerFormat": "",
"shared": false,
"outside": false,
"valueDecimals": null,
"split": false
},
"annotations": null
},
"hc_type": "chart",
"id": "71860910299865345099271703764389596942"
}
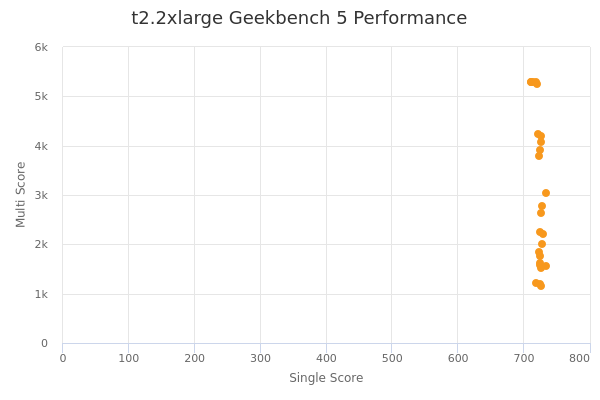
| Single | Multi | |
|---|---|---|
| Max | 734 | 5300 |
| Average | 724 | 2999 |
| Deviation | 5.34 | 1484.25 |
| Min | 712 | 1145 |