r4.4xlarge by Amazon Web Services
Geekbench is a cross-platform processor benchmark with a scoring system that determines single-core and multi-core performance using loads simulating real-world scenarios. Geekbench 5 score is calculated with a reference score of 2500 representing the performance of the Intel Core i5-2520M @ 2.50 GHz. The software benchmark is available for Mac OS, Windows, Linux, Android and iOS platforms.
Specifications:
CPU
16
RAM
122.0 GB
Net
10000 Mbps
{
"configuration": {
"chart": {
"type": "scatter",
"polar": false,
"zoomType": "",
"options3d": {},
"height": null,
"width": null,
"margin": null,
"inverted": false,
"zooming": {}
},
"credits": {
"enabled": false
},
"title": {
"text": ""
},
"colorAxis": null,
"subtitle": {
"text": ""
},
"xAxis": {
"title": {
"text": [
"Single Score"
],
"useHTML": false,
"style": {
"color": "#666666"
}
},
"categories": null,
"lineWidth": 1,
"tickInterval": null,
"tickWidth": 1,
"tickLength": 10,
"tickPixelInterval": 100,
"plotLines": null,
"labels": {
"enabled": true,
"format": null,
"formatter": "",
"style": {
"color": "#666666",
"cursor": "default",
"fontSize": "11px"
},
"useHTML": false,
"step": 0
},
"plotBands": null,
"visible": true,
"floor": null,
"ceiling": null,
"type": "linear",
"min": 0,
"gridLineWidth": 1,
"gridLineColor": "#e6e6e6",
"minorTickInterval": null,
"minorTickWidth": 0,
"minTickInterval": null,
"startOnTick": true,
"endOnTick": true,
"tickmarkPlacement": 100,
"units": 100,
"minRange": 100
},
"yAxis": {
"title": {
"text": [
"Multi Score"
],
"useHTML": false,
"style": {
"color": "#666666"
}
},
"categories": null,
"plotLines": null,
"plotBands": null,
"lineWidth": null,
"tickInterval": null,
"tickLength": 10,
"floor": null,
"ceiling": null,
"gridLineInterpolation": null,
"gridLineWidth": 1,
"gridLineColor": "#e6e6e6",
"min": 0,
"max": null,
"minorTickInterval": null,
"minorTickWidth": 0,
"minTickInterval": null,
"startOnTick": true,
"endOnTick": true,
"minRange": null,
"type": "linear",
"tickmarkPlacement": null,
"labels": {
"enabled": true,
"formatter": null,
"style": {
"color": "#666666",
"cursor": "default",
"fontSize": "11px"
},
"useHTML": false
}
},
"zAxis": {
"title": {
"text": "Multi Score"
}
},
"plotOptions": {
"series": {
"dataLabels": {
"enabled": false,
"format": null,
"distance": 30,
"align": "center",
"inside": null,
"allowOverlap": false,
"style": {
"fontSize": "11px"
}
},
"showInLegend": null,
"turboThreshold": 0,
"stacking": "",
"groupPadding": 0.2,
"centerInCategory": false,
"findNearestPointBy": "x"
}
},
"navigator": {
"enabled": false
},
"scrollbar": {
"enabled": false
},
"rangeSelector": {
"enabled": false,
"inputEnabled": false
},
"legend": {
"enabled": null,
"maxHeight": null,
"align": "center",
"verticalAlign": "bottom",
"layout": "horizontal",
"width": null,
"margin": 12,
"reversed": false
},
"series": [
{
"name": "r4.4xlarge by Amazon Web Services",
"color": "#f7981d",
"data": [
{
"x": 759.5664139513958,
"y": 6352.439519348747
},
{
"x": 752.9225512243088,
"y": 6346.550885116375
},
{
"x": 755.4840493941995,
"y": 6353.068071720421
},
{
"x": 749.4677356037823,
"y": 6358.504732428595
},
{
"x": 760.1459301186945,
"y": 6340.722745116864
},
{
"x": 758.5290392302882,
"y": 6339.143175903642
},
{
"x": 757.7226658618197,
"y": 6358.520074918382
},
{
"x": 747.9819742205241,
"y": 6356.744333627061
},
{
"x": 760.5483909520069,
"y": 6342.947188786732
},
{
"x": 755.1649412638922,
"y": 6346.725476609921
},
{
"x": 757.4979018379388,
"y": 6338.294144177604
},
{
"x": 755.5361798772335,
"y": 6353.4082916436655
},
{
"x": 757.0371869093435,
"y": 6324.931481256504
},
{
"x": 746.8445889001832,
"y": 6330.903639399715
},
{
"x": 754.5528932833038,
"y": 6352.249502026782
},
{
"x": 758.7658224714195,
"y": 6356.363672695714
},
{
"x": 756.7516540933179,
"y": 6346.537387829642
},
{
"x": 757.078452052643,
"y": 6333.569472915895
},
{
"x": 759.7004066729329,
"y": 6336.46009093463
},
{
"x": 759.8176946320627,
"y": 6334.0977350503035
}
]
}
],
"drilldown": {},
"tooltip": {
"enabled": true,
"useHTML": false,
"format": null,
"headerFormat": "",
"pointFormat": "<span style=\"color:{series.color}\">Single</span>: <b>{point.x:.0f}</b><br><span style=\"color:{series.color}\">Multi</span>: <b>{point.y:.0f}</b>",
"footerFormat": "",
"shared": false,
"outside": false,
"valueDecimals": null,
"split": false
},
"annotations": null
},
"hc_type": "chart",
"id": "250893407318673274880462276031806015270"
}
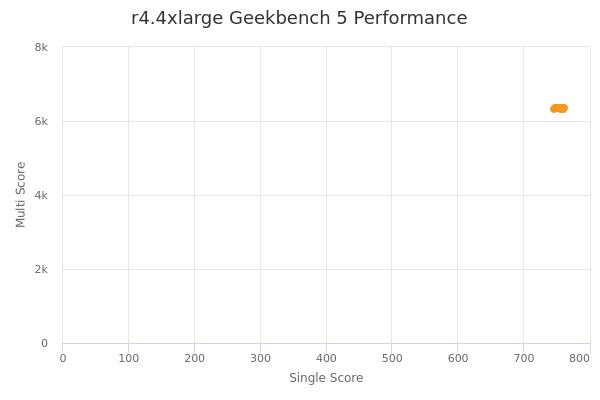
| Single | Multi | |
|---|---|---|
| Max | 761 | 6359 |
| Average | 756 | 6345 |
| Deviation | 3.90 | 9.77 |
| Min | 747 | 6325 |
Sign up as Freemium to get more insight.
- In same series
- r4.large
- r4.xlarge
- r4.2xlarge
- r4.4xlarge
- r4.8xlarge
- r4.16xlarge