m7i-flex.8xlarge by Amazon Web Services
Geekbench is a cross-platform processor benchmark with a scoring system that determines single-core and multi-core performance using loads simulating real-world scenarios. Geekbench 5 score is calculated with a reference score of 2500 representing the performance of the Intel Core i5-2520M @ 2.50 GHz. The software benchmark is available for Mac OS, Windows, Linux, Android and iOS platforms.
Specifications:
CPU
32
RAM
128.0 GB
Net
12000 Mbps
{
"configuration": {
"chart": {
"type": "scatter",
"polar": false,
"zoomType": "",
"options3d": {},
"height": null,
"width": null,
"margin": null,
"inverted": false,
"zooming": {}
},
"credits": {
"enabled": false
},
"title": {
"text": ""
},
"colorAxis": null,
"subtitle": {
"text": ""
},
"xAxis": {
"title": {
"text": [
"Single Score"
],
"useHTML": false,
"style": {
"color": "#666666"
}
},
"categories": null,
"lineWidth": 1,
"tickInterval": null,
"tickWidth": 1,
"tickLength": 10,
"tickPixelInterval": 100,
"plotLines": null,
"labels": {
"enabled": true,
"format": null,
"formatter": "",
"style": {
"color": "#666666",
"cursor": "default",
"fontSize": "11px"
},
"useHTML": false,
"step": 0
},
"plotBands": null,
"visible": true,
"floor": null,
"ceiling": null,
"type": "linear",
"min": 0,
"gridLineWidth": 1,
"gridLineColor": "#e6e6e6",
"minorTickInterval": null,
"minorTickWidth": 0,
"minTickInterval": null,
"startOnTick": true,
"endOnTick": true,
"tickmarkPlacement": 100,
"units": 100,
"minRange": 100
},
"yAxis": {
"title": {
"text": [
"Multi Score"
],
"useHTML": false,
"style": {
"color": "#666666"
}
},
"categories": null,
"plotLines": null,
"plotBands": null,
"lineWidth": null,
"tickInterval": null,
"tickLength": 10,
"floor": null,
"ceiling": null,
"gridLineInterpolation": null,
"gridLineWidth": 1,
"gridLineColor": "#e6e6e6",
"min": 0,
"max": null,
"minorTickInterval": null,
"minorTickWidth": 0,
"minTickInterval": null,
"startOnTick": true,
"endOnTick": true,
"minRange": null,
"type": "linear",
"tickmarkPlacement": null,
"labels": {
"enabled": true,
"formatter": null,
"style": {
"color": "#666666",
"cursor": "default",
"fontSize": "11px"
},
"useHTML": false
}
},
"zAxis": {
"title": {
"text": "Multi Score"
}
},
"plotOptions": {
"series": {
"dataLabels": {
"enabled": false,
"format": null,
"distance": 30,
"align": "center",
"inside": null,
"allowOverlap": false,
"style": {
"fontSize": "11px"
}
},
"showInLegend": null,
"turboThreshold": 0,
"stacking": "",
"groupPadding": 0.2,
"centerInCategory": false,
"findNearestPointBy": "x"
}
},
"navigator": {
"enabled": false
},
"scrollbar": {
"enabled": false
},
"rangeSelector": {
"enabled": false,
"inputEnabled": false
},
"legend": {
"enabled": null,
"maxHeight": null,
"align": "center",
"verticalAlign": "bottom",
"layout": "horizontal",
"width": null,
"margin": 12,
"reversed": false
},
"series": [
{
"name": "m7i-flex.8xlarge by Amazon Web Services",
"color": "#f7981d",
"data": [
{
"x": 1314.723615587016,
"y": 20404.013358659562
},
{
"x": 1315.5120595799635,
"y": 18729.190090217515
},
{
"x": 1465.1397694470975,
"y": 24414.380954817552
},
{
"x": 1384.7277563900436,
"y": 21803.17809697785
},
{
"x": 1345.9180378364545,
"y": 20136.710638284127
},
{
"x": 1318.83883633213,
"y": 18349.143977319145
},
{
"x": 1451.9906305143413,
"y": 24313.398555965126
},
{
"x": 1369.3418055800566,
"y": 21398.864815492947
},
{
"x": 1318.8568597171768,
"y": 20503.227247684386
},
{
"x": 1322.0159384506921,
"y": 18877.688477638374
},
{
"x": 1459.2133932637955,
"y": 24362.374916961315
},
{
"x": 1375.0234597876884,
"y": 20977.21511136836
},
{
"x": 1317.443824038682,
"y": 20291.86166744746
},
{
"x": 1333.7243730823814,
"y": 17657.073754462905
},
{
"x": 1468.7779858114986,
"y": 24017.965512567396
},
{
"x": 1353.720667228697,
"y": 21657.151662803277
},
{
"x": 1318.084035609279,
"y": 20170.71452471887
},
{
"x": 1323.0878378984855,
"y": 19193.654101094915
},
{
"x": 1449.8429125576806,
"y": 24060.506204504647
},
{
"x": 1356.5849669869463,
"y": 21455.02930464242
},
{
"x": 1349.3281531082694,
"y": 20258.630958285867
},
{
"x": 1310.72024361611,
"y": 18321.78248142405
},
{
"x": 1374.873544404552,
"y": 22192.266957156156
},
{
"x": 1376.6885332383624,
"y": 22081.620921728485
},
{
"x": 1335.4844663714878,
"y": 20202.293452310616
},
{
"x": 1321.877753349822,
"y": 19064.986270357866
},
{
"x": 1380.107592112228,
"y": 21316.806692238453
},
{
"x": 1370.8779632777973,
"y": 21179.23600326245
},
{
"x": 1325.3487390049181,
"y": 20230.95129298637
},
{
"x": 1290.0540813544335,
"y": 19206.31403191474
},
{
"x": 1370.0919775118682,
"y": 21241.430271926372
},
{
"x": 1384.866771001192,
"y": 22314.94653306547
},
{
"x": 1353.9993168888986,
"y": 20300.50193848958
},
{
"x": 1324.7007993181705,
"y": 19644.4899657037
},
{
"x": 1357.7213098945906,
"y": 21091.27110042553
},
{
"x": 1370.2273931425907,
"y": 21872.06666405084
},
{
"x": 1319.559024371078,
"y": 20589.29832727572
},
{
"x": 1324.9338943692767,
"y": 19184.194493801304
},
{
"x": 1366.3293238579906,
"y": 20730.601728147274
},
{
"x": 1385.8717399742698,
"y": 21694.643464389144
}
]
}
],
"drilldown": {},
"tooltip": {
"enabled": true,
"useHTML": false,
"format": null,
"headerFormat": "",
"pointFormat": "<span style=\"color:{series.color}\">Single</span>: <b>{point.x:.0f}</b><br><span style=\"color:{series.color}\">Multi</span>: <b>{point.y:.0f}</b>",
"footerFormat": "",
"shared": false,
"outside": false,
"valueDecimals": null,
"split": false
},
"annotations": null
},
"hc_type": "chart",
"id": "90352658763397963554868183610548783113"
}
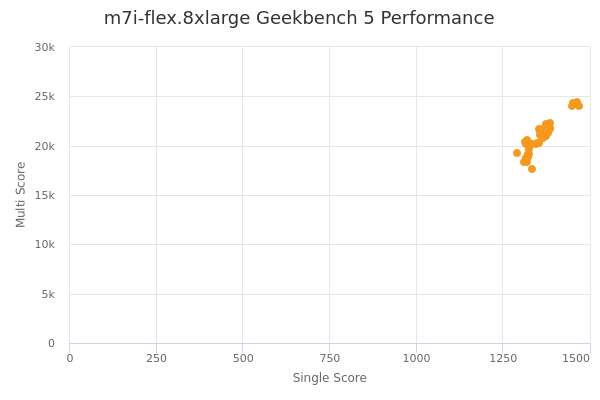
| Single | Multi | |
|---|---|---|
| Max | 1469 | 24414 |
| Average | 1359 | 20887 |
| Deviation | 45.35 | 1692.29 |
| Min | 1290 | 17657 |
Sign up as Freemium to get more insight.