m5d.xlarge by Amazon Web Services
Geekbench is a cross-platform processor benchmark with a scoring system that determines single-core and multi-core performance using loads simulating real-world scenarios. Geekbench 5 score is calculated with a reference score of 2500 representing the performance of the Intel Core i5-2520M @ 2.50 GHz. The software benchmark is available for Mac OS, Windows, Linux, Android and iOS platforms.
Specifications:
CPU
4
RAM
16.0 GB
Extra
1x
150 GB
NVMe SSD
Net
10000 Mbps
{
"configuration": {
"chart": {
"type": "scatter",
"polar": false,
"zoomType": "",
"options3d": {},
"height": null,
"width": null,
"margin": null,
"inverted": false,
"zooming": {}
},
"credits": {
"enabled": false
},
"title": {
"text": ""
},
"colorAxis": null,
"subtitle": {
"text": ""
},
"xAxis": {
"title": {
"text": [
"Single Score"
],
"useHTML": false,
"style": {
"color": "#666666"
}
},
"categories": null,
"lineWidth": 1,
"tickInterval": null,
"tickWidth": 1,
"tickLength": 10,
"tickPixelInterval": 100,
"plotLines": null,
"labels": {
"enabled": true,
"format": null,
"formatter": "",
"style": {
"color": "#666666",
"cursor": "default",
"fontSize": "11px"
},
"useHTML": false,
"step": 0
},
"plotBands": null,
"visible": true,
"floor": null,
"ceiling": null,
"type": "linear",
"min": 0,
"gridLineWidth": 1,
"gridLineColor": "#e6e6e6",
"minorTickInterval": null,
"minorTickWidth": 0,
"minTickInterval": null,
"startOnTick": true,
"endOnTick": true,
"tickmarkPlacement": 100,
"units": 100,
"minRange": 100
},
"yAxis": {
"title": {
"text": [
"Multi Score"
],
"useHTML": false,
"style": {
"color": "#666666"
}
},
"categories": null,
"plotLines": null,
"plotBands": null,
"lineWidth": null,
"tickInterval": null,
"tickLength": 10,
"floor": null,
"ceiling": null,
"gridLineInterpolation": null,
"gridLineWidth": 1,
"gridLineColor": "#e6e6e6",
"min": 0,
"max": null,
"minorTickInterval": null,
"minorTickWidth": 0,
"minTickInterval": null,
"startOnTick": true,
"endOnTick": true,
"minRange": null,
"type": "linear",
"tickmarkPlacement": null,
"labels": {
"enabled": true,
"formatter": null,
"style": {
"color": "#666666",
"cursor": "default",
"fontSize": "11px"
},
"useHTML": false
}
},
"zAxis": {
"title": {
"text": "Multi Score"
}
},
"plotOptions": {
"series": {
"dataLabels": {
"enabled": false,
"format": null,
"distance": 30,
"align": "center",
"inside": null,
"allowOverlap": false,
"style": {
"fontSize": "11px"
}
},
"showInLegend": null,
"turboThreshold": 0,
"stacking": "",
"groupPadding": 0.2,
"centerInCategory": false,
"findNearestPointBy": "x"
}
},
"navigator": {
"enabled": false
},
"scrollbar": {
"enabled": false
},
"rangeSelector": {
"enabled": false,
"inputEnabled": false
},
"legend": {
"enabled": null,
"maxHeight": null,
"align": "center",
"verticalAlign": "bottom",
"layout": "horizontal",
"width": null,
"margin": 12,
"reversed": false
},
"series": [
{
"name": "m5d.xlarge by Amazon Web Services",
"color": "#f7981d",
"data": [
{
"x": 859.2542331714296,
"y": 2008.729557682851
},
{
"x": 844.0788415231937,
"y": 2007.3481141917384
},
{
"x": 855.3335477681629,
"y": 2048.327724236797
},
{
"x": 858.5505311185891,
"y": 2006.9856585902348
},
{
"x": 864.7856916350283,
"y": 2034.3147157128133
},
{
"x": 858.4672626592915,
"y": 2024.4718249024218
},
{
"x": 870.7835557074814,
"y": 2055.1767244141915
},
{
"x": 857.9271456952122,
"y": 2013.2026360205564
},
{
"x": 861.2729647091514,
"y": 2044.1270978492848
},
{
"x": 852.0523151192333,
"y": 2009.3630458664156
},
{
"x": 859.3691256380082,
"y": 1990.7331156832465
},
{
"x": 865.2932130653796,
"y": 1592.8782589306684
},
{
"x": 841.6548444987741,
"y": 1993.4794634762998
},
{
"x": 823.9405699734491,
"y": 1567.978008229229
},
{
"x": 845.8877366727627,
"y": 1978.8402687101516
},
{
"x": 809.9911031868322,
"y": 1952.9411934919663
},
{
"x": 841.0138905837041,
"y": 1984.6166047524748
},
{
"x": 852.6833799698202,
"y": 2022.579010515526
},
{
"x": 839.5656300163735,
"y": 1981.6481842097858
},
{
"x": 853.4717535917779,
"y": 2006.575183789299
}
]
}
],
"drilldown": {},
"tooltip": {
"enabled": true,
"useHTML": false,
"format": null,
"headerFormat": "",
"pointFormat": "<span style=\"color:{series.color}\">Single</span>: <b>{point.x:.0f}</b><br><span style=\"color:{series.color}\">Multi</span>: <b>{point.y:.0f}</b>",
"footerFormat": "",
"shared": false,
"outside": false,
"valueDecimals": null,
"split": false
},
"annotations": null
},
"hc_type": "chart",
"id": "30778960475106547104996486947089794595"
}
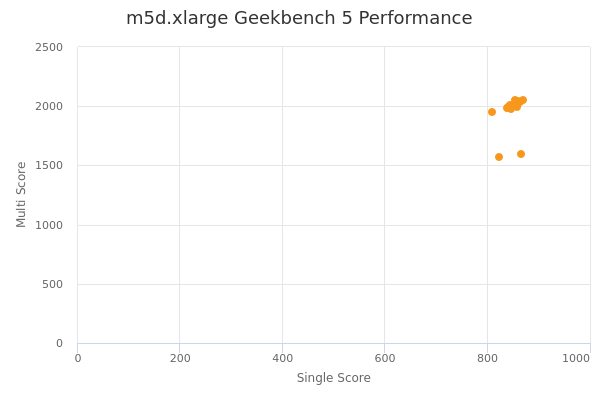
| Single | Multi | |
|---|---|---|
| Max | 871 | 2055 |
| Average | 851 | 1966 |
| Deviation | 14.18 | 130.96 |
| Min | 810 | 1568 |
Sign up as Freemium to get more insight.