m5ad.xlarge by Amazon Web Services
Geekbench is a cross-platform processor benchmark with a scoring system that determines single-core and multi-core performance using loads simulating real-world scenarios. Geekbench 5 score is calculated with a reference score of 2500 representing the performance of the Intel Core i5-2520M @ 2.50 GHz. The software benchmark is available for Mac OS, Windows, Linux, Android and iOS platforms.
Specifications:
CPU
4
RAM
16.0 GB
Extra
1x
150 GB
NVMe SSD
Net
10000 Mbps
{
"configuration": {
"chart": {
"type": "scatter",
"polar": false,
"zoomType": "",
"options3d": {},
"height": null,
"width": null,
"margin": null,
"inverted": false,
"zooming": {}
},
"credits": {
"enabled": false
},
"title": {
"text": ""
},
"colorAxis": null,
"subtitle": {
"text": ""
},
"xAxis": {
"title": {
"text": [
"Single Score"
],
"useHTML": false,
"style": {
"color": "#666666"
}
},
"categories": null,
"lineWidth": 1,
"tickInterval": null,
"tickWidth": 1,
"tickLength": 10,
"tickPixelInterval": 100,
"plotLines": null,
"labels": {
"enabled": true,
"format": null,
"formatter": "",
"style": {
"color": "#666666",
"cursor": "default",
"fontSize": "11px"
},
"useHTML": false,
"step": 0
},
"plotBands": null,
"visible": true,
"floor": null,
"ceiling": null,
"type": "linear",
"min": 0,
"gridLineWidth": 1,
"gridLineColor": "#e6e6e6",
"minorTickInterval": null,
"minorTickWidth": 0,
"minTickInterval": null,
"startOnTick": true,
"endOnTick": true,
"tickmarkPlacement": 100,
"units": 100,
"minRange": 100
},
"yAxis": {
"title": {
"text": [
"Multi Score"
],
"useHTML": false,
"style": {
"color": "#666666"
}
},
"categories": null,
"plotLines": null,
"plotBands": null,
"lineWidth": null,
"tickInterval": null,
"tickLength": 10,
"floor": null,
"ceiling": null,
"gridLineInterpolation": null,
"gridLineWidth": 1,
"gridLineColor": "#e6e6e6",
"min": 0,
"max": null,
"minorTickInterval": null,
"minorTickWidth": 0,
"minTickInterval": null,
"startOnTick": true,
"endOnTick": true,
"minRange": null,
"type": "linear",
"tickmarkPlacement": null,
"labels": {
"enabled": true,
"formatter": null,
"style": {
"color": "#666666",
"cursor": "default",
"fontSize": "11px"
},
"useHTML": false
}
},
"zAxis": {
"title": {
"text": "Multi Score"
}
},
"plotOptions": {
"series": {
"dataLabels": {
"enabled": false,
"format": null,
"distance": 30,
"align": "center",
"inside": null,
"allowOverlap": false,
"style": {
"fontSize": "11px"
}
},
"showInLegend": null,
"turboThreshold": 0,
"stacking": "",
"groupPadding": 0.2,
"centerInCategory": false,
"findNearestPointBy": "x"
}
},
"navigator": {
"enabled": false
},
"scrollbar": {
"enabled": false
},
"rangeSelector": {
"enabled": false,
"inputEnabled": false
},
"legend": {
"enabled": null,
"maxHeight": null,
"align": "center",
"verticalAlign": "bottom",
"layout": "horizontal",
"width": null,
"margin": 12,
"reversed": false
},
"series": [
{
"name": "m5ad.xlarge by Amazon Web Services",
"color": "#f7981d",
"data": [
{
"x": 700.6914572809462,
"y": 1711.3671015887392
},
{
"x": 695.4143621496752,
"y": 1712.029721314405
},
{
"x": 697.3495468063497,
"y": 1711.0153732223807
},
{
"x": 696.560336053834,
"y": 1713.0802259340924
},
{
"x": 697.6600823531899,
"y": 1710.8462657681425
},
{
"x": 698.4462150322613,
"y": 1701.291658119971
},
{
"x": 701.9567702950247,
"y": 1708.8192512703258
},
{
"x": 699.6283264071451,
"y": 1713.511473736457
},
{
"x": 703.4760364819057,
"y": 1711.1804411720723
},
{
"x": 699.132137606539,
"y": 1713.353715917855
},
{
"x": 713.5423635936486,
"y": 1741.7604112826755
},
{
"x": 701.3152648548025,
"y": 1711.4062241034887
},
{
"x": 711.5111399332366,
"y": 1750.135084750285
},
{
"x": 693.884150858372,
"y": 1707.8145518606798
},
{
"x": 716.6254068612616,
"y": 1748.9678815377865
},
{
"x": 694.8409433070337,
"y": 1710.8334369975878
},
{
"x": 711.077258354693,
"y": 1743.5701917588756
},
{
"x": 696.380722511888,
"y": 1708.4725499266704
},
{
"x": 710.506451066859,
"y": 1738.405256490419
},
{
"x": 696.3487737686487,
"y": 1707.4892832795317
},
{
"x": 714.5289498455921,
"y": 1741.9910520224307
},
{
"x": 696.2348047357518,
"y": 1715.035292317184
},
{
"x": 713.9694989326167,
"y": 1752.120958483444
},
{
"x": 694.8907260467174,
"y": 1707.9497421642175
},
{
"x": 712.4197319169805,
"y": 1744.2476600358978
},
{
"x": 692.7466224068216,
"y": 1702.4822996000612
},
{
"x": 714.5015527846066,
"y": 1747.2574353482628
},
{
"x": 696.4491966098751,
"y": 1710.211140086246
},
{
"x": 710.4984398445683,
"y": 1750.5545657982057
},
{
"x": 695.6462725407464,
"y": 1709.1020380858736
}
]
}
],
"drilldown": {},
"tooltip": {
"enabled": true,
"useHTML": false,
"format": null,
"headerFormat": "",
"pointFormat": "<span style=\"color:{series.color}\">Single</span>: <b>{point.x:.0f}</b><br><span style=\"color:{series.color}\">Multi</span>: <b>{point.y:.0f}</b>",
"footerFormat": "",
"shared": false,
"outside": false,
"valueDecimals": null,
"split": false
},
"annotations": null
},
"hc_type": "chart",
"id": "327215445456848416317318214108573746687"
}
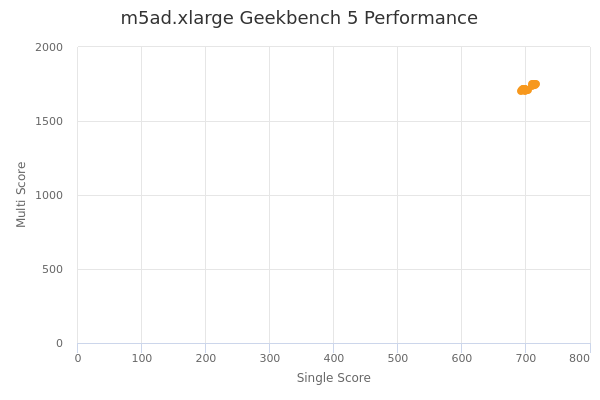
| Single | Multi | |
|---|---|---|
| Max | 717 | 1752 |
| Average | 703 | 1722 |
| Deviation | 7.71 | 17.38 |
| Min | 693 | 1701 |
Sign up as Freemium to get more insight.