m5a.xlarge by Amazon Web Services
Geekbench is a cross-platform processor benchmark with a scoring system that determines single-core and multi-core performance using loads simulating real-world scenarios. Geekbench 5 score is calculated with a reference score of 2500 representing the performance of the Intel Core i5-2520M @ 2.50 GHz. The software benchmark is available for Mac OS, Windows, Linux, Android and iOS platforms.
Specifications:
CPU
4
RAM
16.0 GB
Net
10000 Mbps
{
"configuration": {
"chart": {
"type": "scatter",
"polar": false,
"zoomType": "",
"options3d": {},
"height": null,
"width": null,
"margin": null,
"inverted": false,
"zooming": {}
},
"credits": {
"enabled": false
},
"title": {
"text": ""
},
"colorAxis": null,
"subtitle": {
"text": ""
},
"xAxis": {
"title": {
"text": [
"Single Score"
],
"useHTML": false,
"style": {
"color": "#666666"
}
},
"categories": null,
"lineWidth": 1,
"tickInterval": null,
"tickWidth": 1,
"tickLength": 10,
"tickPixelInterval": 100,
"plotLines": null,
"labels": {
"enabled": true,
"format": null,
"formatter": "",
"style": {
"color": "#666666",
"cursor": "default",
"fontSize": "11px"
},
"useHTML": false,
"step": 0
},
"plotBands": null,
"visible": true,
"floor": null,
"ceiling": null,
"type": "linear",
"min": 0,
"gridLineWidth": 1,
"gridLineColor": "#e6e6e6",
"minorTickInterval": null,
"minorTickWidth": 0,
"minTickInterval": null,
"startOnTick": true,
"endOnTick": true,
"tickmarkPlacement": 100,
"units": 100,
"minRange": 100
},
"yAxis": {
"title": {
"text": [
"Multi Score"
],
"useHTML": false,
"style": {
"color": "#666666"
}
},
"categories": null,
"plotLines": null,
"plotBands": null,
"lineWidth": null,
"tickInterval": null,
"tickLength": 10,
"floor": null,
"ceiling": null,
"gridLineInterpolation": null,
"gridLineWidth": 1,
"gridLineColor": "#e6e6e6",
"min": 0,
"max": null,
"minorTickInterval": null,
"minorTickWidth": 0,
"minTickInterval": null,
"startOnTick": true,
"endOnTick": true,
"minRange": null,
"type": "linear",
"tickmarkPlacement": null,
"labels": {
"enabled": true,
"formatter": null,
"style": {
"color": "#666666",
"cursor": "default",
"fontSize": "11px"
},
"useHTML": false
}
},
"zAxis": {
"title": {
"text": "Multi Score"
}
},
"plotOptions": {
"series": {
"dataLabels": {
"enabled": false,
"format": null,
"distance": 30,
"align": "center",
"inside": null,
"allowOverlap": false,
"style": {
"fontSize": "11px"
}
},
"showInLegend": null,
"turboThreshold": 0,
"stacking": "",
"groupPadding": 0.2,
"centerInCategory": false,
"findNearestPointBy": "x"
}
},
"navigator": {
"enabled": false
},
"scrollbar": {
"enabled": false
},
"rangeSelector": {
"enabled": false,
"inputEnabled": false
},
"legend": {
"enabled": null,
"maxHeight": null,
"align": "center",
"verticalAlign": "bottom",
"layout": "horizontal",
"width": null,
"margin": 12,
"reversed": false
},
"series": [
{
"name": "m5a.xlarge by Amazon Web Services",
"color": "#f7981d",
"data": [
{
"x": 730.8862535546496,
"y": 1698.3500837075255
},
{
"x": 725.7504996923522,
"y": 1711.0628879797748
},
{
"x": 739.1380415864361,
"y": 1706.7106856633561
},
{
"x": 721.016024500368,
"y": 1713.5208500374401
},
{
"x": 733.1412136876922,
"y": 1695.9522220530266
},
{
"x": 724.246053336137,
"y": 1711.9160694593393
},
{
"x": 735.9751997616562,
"y": 1696.2400754112878
},
{
"x": 724.6646956353779,
"y": 1720.2379713336704
},
{
"x": 741.9386099759406,
"y": 1696.7198402878735
},
{
"x": 728.2738986195818,
"y": 1711.377099625103
},
{
"x": 715.0879929305393,
"y": 1742.0352097131504
},
{
"x": 687.4031858224608,
"y": 1738.0591967371174
},
{
"x": 714.0133646337335,
"y": 1743.4016247627635
},
{
"x": 689.6507849917031,
"y": 1735.8663626763594
},
{
"x": 709.4942539655531,
"y": 1743.2502196992468
},
{
"x": 702.0010196572384,
"y": 1736.888508244566
},
{
"x": 707.1431288142961,
"y": 1731.5055279205944
},
{
"x": 687.6626857414288,
"y": 1736.392517578165
},
{
"x": 705.9893545526464,
"y": 1742.573531959597
},
{
"x": 694.0138328920189,
"y": 1740.6071317150836
},
{
"x": 708.3289848806623,
"y": 1735.2284102827957
},
{
"x": 702.7474453225249,
"y": 1735.9247335881987
},
{
"x": 709.812255083688,
"y": 1743.4615229577282
},
{
"x": 706.1350003086661,
"y": 1722.8095396242384
},
{
"x": 710.8996513227839,
"y": 1741.8951631839998
},
{
"x": 707.4760052051023,
"y": 1743.3291214858075
},
{
"x": 709.5078670836397,
"y": 1746.031079004076
},
{
"x": 696.0252370644075,
"y": 1741.433535964401
},
{
"x": 713.4826412040463,
"y": 1745.5416449767226
},
{
"x": 687.8683708110339,
"y": 1737.0752149974405
},
{
"x": 716.4142858589114,
"y": 1751.7536364335765
},
{
"x": 674.5950159742838,
"y": 1746.9966899234719
},
{
"x": 718.8438050028874,
"y": 1757.9519118480846
},
{
"x": 713.2916928864101,
"y": 1745.9875468539235
},
{
"x": 712.1815313709908,
"y": 1744.0402257435721
},
{
"x": 718.6525533441202,
"y": 1218.0285945442429
},
{
"x": 707.5988429707496,
"y": 1748.5746626252824
},
{
"x": 673.5623534496385,
"y": 1320.673372683736
},
{
"x": 713.6655259522731,
"y": 1742.899619681432
},
{
"x": 663.1946177619349,
"y": 1748.5058935705129
},
{
"x": 714.4510651532783,
"y": 1749.0371349266952
},
{
"x": 715.9487115111076,
"y": 1750.5115115904168
},
{
"x": 715.4662056180316,
"y": 1746.634376540051
},
{
"x": 715.8895870810661,
"y": 1747.580010382167
},
{
"x": 715.4682932325039,
"y": 1748.6981385020695
},
{
"x": 713.3082393728499,
"y": 1750.4595011097433
},
{
"x": 716.0245957231881,
"y": 1746.1513825500522
},
{
"x": 715.4803242847023,
"y": 1754.1292362163917
},
{
"x": 714.7157485649207,
"y": 1749.976009677669
},
{
"x": 717.3366949291387,
"y": 1752.6702872871872
}
]
}
],
"drilldown": {},
"tooltip": {
"enabled": true,
"useHTML": false,
"format": null,
"headerFormat": "",
"pointFormat": "<span style=\"color:{series.color}\">Single</span>: <b>{point.x:.0f}</b><br><span style=\"color:{series.color}\">Multi</span>: <b>{point.y:.0f}</b>",
"footerFormat": "",
"shared": false,
"outside": false,
"valueDecimals": null,
"split": false
},
"annotations": null
},
"hc_type": "chart",
"id": "54236306440062761268823385862942166128"
}
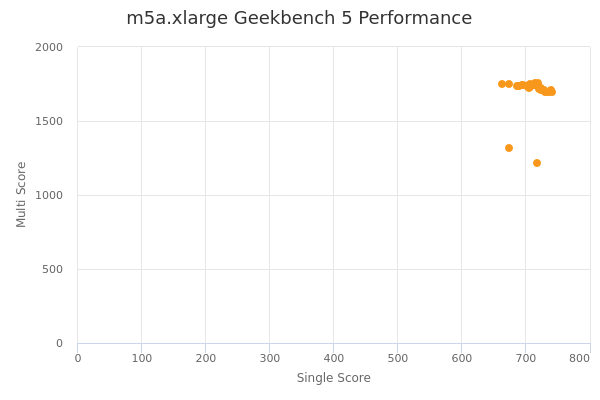
| Single | Multi | |
|---|---|---|
| Max | 742 | 1758 |
| Average | 711 | 1717 |
| Deviation | 15.81 | 93.49 |
| Min | 663 | 1218 |
Sign up as Freemium to get more insight.
- In same series
- m5a.large
- m5a.xlarge
- m5a.2xlarge
- m5a.4xlarge
- m5a.8xlarge
- m5a.12xlarge
- m5a.16xlarge
- m5a.24xlarge