m4.xlarge by Amazon Web Services
Geekbench is a cross-platform processor benchmark with a scoring system that determines single-core and multi-core performance using loads simulating real-world scenarios. Geekbench 5 score is calculated with a reference score of 2500 representing the performance of the Intel Core i5-2520M @ 2.50 GHz. The software benchmark is available for Mac OS, Windows, Linux, Android and iOS platforms.
Specifications:
CPU
4
RAM
16.0 GB
{
"configuration": {
"chart": {
"type": "scatter",
"polar": false,
"zoomType": "",
"options3d": {},
"height": null,
"width": null,
"margin": null,
"inverted": false,
"zooming": {}
},
"credits": {
"enabled": false
},
"title": {
"text": ""
},
"colorAxis": null,
"subtitle": {
"text": ""
},
"xAxis": {
"title": {
"text": [
"Single Score"
],
"useHTML": false,
"style": {
"color": "#666666"
}
},
"categories": null,
"lineWidth": 1,
"tickInterval": null,
"tickWidth": 1,
"tickLength": 10,
"tickPixelInterval": 100,
"plotLines": null,
"labels": {
"enabled": true,
"format": null,
"formatter": "",
"style": {
"color": "#666666",
"cursor": "default",
"fontSize": "11px"
},
"useHTML": false,
"step": 0
},
"plotBands": null,
"visible": true,
"floor": null,
"ceiling": null,
"type": "linear",
"min": 0,
"gridLineWidth": 1,
"gridLineColor": "#e6e6e6",
"minorTickInterval": null,
"minorTickWidth": 0,
"minTickInterval": null,
"startOnTick": true,
"endOnTick": true,
"tickmarkPlacement": 100,
"units": 100,
"minRange": 100
},
"yAxis": {
"title": {
"text": [
"Multi Score"
],
"useHTML": false,
"style": {
"color": "#666666"
}
},
"categories": null,
"plotLines": null,
"plotBands": null,
"lineWidth": null,
"tickInterval": null,
"tickLength": 10,
"floor": null,
"ceiling": null,
"gridLineInterpolation": null,
"gridLineWidth": 1,
"gridLineColor": "#e6e6e6",
"min": 0,
"max": null,
"minorTickInterval": null,
"minorTickWidth": 0,
"minTickInterval": null,
"startOnTick": true,
"endOnTick": true,
"minRange": null,
"type": "linear",
"tickmarkPlacement": null,
"labels": {
"enabled": true,
"formatter": null,
"style": {
"color": "#666666",
"cursor": "default",
"fontSize": "11px"
},
"useHTML": false
}
},
"zAxis": {
"title": {
"text": "Multi Score"
}
},
"plotOptions": {
"series": {
"dataLabels": {
"enabled": false,
"format": null,
"distance": 30,
"align": "center",
"inside": null,
"allowOverlap": false,
"style": {
"fontSize": "11px"
}
},
"showInLegend": null,
"turboThreshold": 0,
"stacking": "",
"groupPadding": 0.2,
"centerInCategory": false,
"findNearestPointBy": "x"
}
},
"navigator": {
"enabled": false
},
"scrollbar": {
"enabled": false
},
"rangeSelector": {
"enabled": false,
"inputEnabled": false
},
"legend": {
"enabled": null,
"maxHeight": null,
"align": "center",
"verticalAlign": "bottom",
"layout": "horizontal",
"width": null,
"margin": 12,
"reversed": false
},
"series": [
{
"name": "m4.xlarge by Amazon Web Services",
"color": "#f7981d",
"data": [
{
"x": 725.6251351303728,
"y": 1680.3451819990528
},
{
"x": 723.9354065409258,
"y": 1639.4447491612887
},
{
"x": 732.715813832175,
"y": 1689.3849508572155
},
{
"x": 715.0737769592207,
"y": 1640.373620224477
},
{
"x": 728.0092422238253,
"y": 1679.9796672599507
},
{
"x": 719.6936772344769,
"y": 1637.594659026612
},
{
"x": 731.9675207029795,
"y": 1684.4240876088559
},
{
"x": 726.6289071093282,
"y": 1631.1761249929227
},
{
"x": 741.8101198558231,
"y": 1686.5390966047773
},
{
"x": 723.652062346203,
"y": 1647.042616216445
},
{
"x": 731.7344028611944,
"y": 1695.6448421240057
},
{
"x": 731.6712543613887,
"y": 1684.9919089936282
},
{
"x": 734.6875098397576,
"y": 1696.4373128377306
},
{
"x": 735.9934258036654,
"y": 1693.0375250187385
},
{
"x": 732.5072382135907,
"y": 1696.4208825708192
},
{
"x": 739.1113473630131,
"y": 1688.1862916387554
},
{
"x": 734.5040614448359,
"y": 1697.128162043055
},
{
"x": 729.8341048274525,
"y": 1690.1104422242106
},
{
"x": 730.3716553199022,
"y": 1694.188689037312
},
{
"x": 729.1661804376706,
"y": 1689.586116205437
},
{
"x": 734.5968435846305,
"y": 1698.0438308666553
},
{
"x": 727.5958863726421,
"y": 1685.0782284921938
},
{
"x": 730.309181329794,
"y": 1695.5777849725891
},
{
"x": 730.9980486115815,
"y": 1691.8045181534796
},
{
"x": 732.5492442142055,
"y": 1695.0741076522531
},
{
"x": 732.1625169079684,
"y": 1687.589693773256
},
{
"x": 732.3044468582636,
"y": 1698.1950559138204
},
{
"x": 723.3686377947735,
"y": 1688.1918929121052
},
{
"x": 732.2706695447587,
"y": 1698.4828063065706
},
{
"x": 736.3995462745747,
"y": 1690.0145914430702
}
]
}
],
"drilldown": {},
"tooltip": {
"enabled": true,
"useHTML": false,
"format": null,
"headerFormat": "",
"pointFormat": "<span style=\"color:{series.color}\">Single</span>: <b>{point.x:.0f}</b><br><span style=\"color:{series.color}\">Multi</span>: <b>{point.y:.0f}</b>",
"footerFormat": "",
"shared": false,
"outside": false,
"valueDecimals": null,
"split": false
},
"annotations": null
},
"hc_type": "chart",
"id": "255712885883548182618096404314951599935"
}
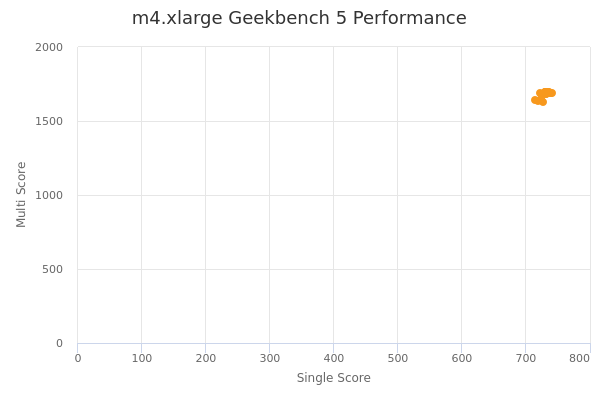
| Single | Multi | |
|---|---|---|
| Max | 742 | 1698 |
| Average | 730 | 1682 |
| Deviation | 5.46 | 20.05 |
| Min | 715 | 1631 |
Sign up as Freemium to get more insight.
- In same series
- m4.large
- m4.xlarge
- m4.2xlarge
- m4.4xlarge
- m4.10xlarge
- m4.16xlarge