g4dn.xlarge by Amazon Web Services
Geekbench is a cross-platform processor benchmark with a scoring system that determines single-core and multi-core performance using loads simulating real-world scenarios. Geekbench 5 score is calculated with a reference score of 2500 representing the performance of the Intel Core i5-2520M @ 2.50 GHz. The software benchmark is available for Mac OS, Windows, Linux, Android and iOS platforms.
Specifications:
CPU
4
RAM
16.0 GB
GPU
1
Extra
1x
125 GB
NVMe SSD
Net
25000 Mbps
{
"configuration": {
"chart": {
"type": "scatter",
"polar": false,
"zoomType": "",
"options3d": {},
"height": null,
"width": null,
"margin": null,
"inverted": false,
"zooming": {}
},
"credits": {
"enabled": false
},
"title": {
"text": ""
},
"colorAxis": null,
"subtitle": {
"text": ""
},
"xAxis": {
"title": {
"text": [
"Single Score"
],
"useHTML": false,
"style": {
"color": "#666666"
}
},
"categories": null,
"lineWidth": 1,
"tickInterval": null,
"tickWidth": 1,
"tickLength": 10,
"tickPixelInterval": 100,
"plotLines": null,
"labels": {
"enabled": true,
"format": null,
"formatter": "",
"style": {
"color": "#666666",
"cursor": "default",
"fontSize": "11px"
},
"useHTML": false,
"step": 0
},
"plotBands": null,
"visible": true,
"floor": null,
"ceiling": null,
"type": "linear",
"min": 0,
"gridLineWidth": 1,
"gridLineColor": "#e6e6e6",
"minorTickInterval": null,
"minorTickWidth": 0,
"minTickInterval": null,
"startOnTick": true,
"endOnTick": true,
"tickmarkPlacement": 100,
"units": 100,
"minRange": 100
},
"yAxis": {
"title": {
"text": [
"Multi Score"
],
"useHTML": false,
"style": {
"color": "#666666"
}
},
"categories": null,
"plotLines": null,
"plotBands": null,
"lineWidth": null,
"tickInterval": null,
"tickLength": 10,
"floor": null,
"ceiling": null,
"gridLineInterpolation": null,
"gridLineWidth": 1,
"gridLineColor": "#e6e6e6",
"min": 0,
"max": null,
"minorTickInterval": null,
"minorTickWidth": 0,
"minTickInterval": null,
"startOnTick": true,
"endOnTick": true,
"minRange": null,
"type": "linear",
"tickmarkPlacement": null,
"labels": {
"enabled": true,
"formatter": null,
"style": {
"color": "#666666",
"cursor": "default",
"fontSize": "11px"
},
"useHTML": false
}
},
"zAxis": {
"title": {
"text": "Multi Score"
}
},
"plotOptions": {
"series": {
"dataLabels": {
"enabled": false,
"format": null,
"distance": 30,
"align": "center",
"inside": null,
"allowOverlap": false,
"style": {
"fontSize": "11px"
}
},
"showInLegend": null,
"turboThreshold": 0,
"stacking": "",
"groupPadding": 0.2,
"centerInCategory": false,
"findNearestPointBy": "x"
}
},
"navigator": {
"enabled": false
},
"scrollbar": {
"enabled": false
},
"rangeSelector": {
"enabled": false,
"inputEnabled": false
},
"legend": {
"enabled": null,
"maxHeight": null,
"align": "center",
"verticalAlign": "bottom",
"layout": "horizontal",
"width": null,
"margin": 12,
"reversed": false
},
"series": [
{
"name": "g4dn.xlarge by Amazon Web Services",
"color": "#f7981d",
"data": [
{
"x": 933.9208450078429,
"y": 2149.30398365518
},
{
"x": 918.0930080228654,
"y": 2125.7393289782103
},
{
"x": 934.7309875800452,
"y": 2146.4696704650614
},
{
"x": 917.5314613999899,
"y": 2131.2586484040794
},
{
"x": 933.8761693140734,
"y": 2145.2754632198385
},
{
"x": 917.5884548121353,
"y": 2127.801986822215
},
{
"x": 933.776001001105,
"y": 2149.99647798381
},
{
"x": 920.2837370043197,
"y": 2129.306679933157
},
{
"x": 933.225902831392,
"y": 2147.136168241926
},
{
"x": 918.6676576988789,
"y": 2129.9113200255624
},
{
"x": 933.246192947109,
"y": 2146.8190240246463
},
{
"x": 915.5796079179556,
"y": 2130.31291298245
},
{
"x": 934.3394581514403,
"y": 2146.1403875018796
},
{
"x": 916.8790158533207,
"y": 2126.032576752459
},
{
"x": 934.1912663827572,
"y": 2144.143081632423
},
{
"x": 918.0206334636739,
"y": 2130.25517853435
},
{
"x": 931.2688017002159,
"y": 2149.1777770343897
},
{
"x": 917.5208583039444,
"y": 2136.3122933535797
},
{
"x": 931.2978937891767,
"y": 2142.3420927020984
},
{
"x": 918.6511256112151,
"y": 2129.4070506017338
}
]
}
],
"drilldown": {},
"tooltip": {
"enabled": true,
"useHTML": false,
"format": null,
"headerFormat": "",
"pointFormat": "<span style=\"color:{series.color}\">Single</span>: <b>{point.x:.0f}</b><br><span style=\"color:{series.color}\">Multi</span>: <b>{point.y:.0f}</b>",
"footerFormat": "",
"shared": false,
"outside": false,
"valueDecimals": null,
"split": false
},
"annotations": null
},
"hc_type": "chart",
"id": "72230589507041017954233949708703496190"
}
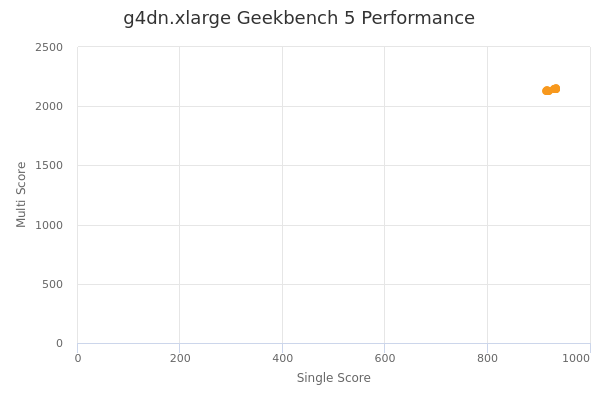
| Single | Multi | |
|---|---|---|
| Max | 935 | 2150 |
| Average | 926 | 2138 |
| Deviation | 7.84 | 8.90 |
| Min | 916 | 2126 |
Sign up as Freemium to get more insight.
- In same series
- g4dn.xlarge
- g4dn.2xlarge
- g4dn.4xlarge
- g4dn.8xlarge
- g4dn.12xlarge
- g4dn.16xlarge
- g4dn.metal