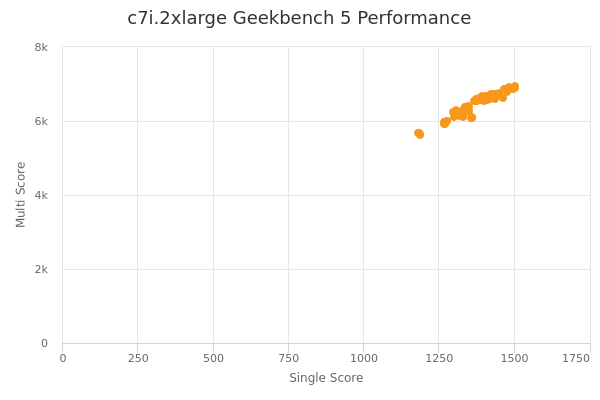
c7i.2xlarge by Amazon Web Services
Geekbench is a cross-platform processor benchmark with a scoring system that determines single-core and multi-core performance using loads simulating real-world scenarios. Geekbench 5 score is calculated with a reference score of 2500 representing the performance of the Intel Core i5-2520M @ 2.50 GHz. The software benchmark is available for Mac OS, Windows, Linux, Android and iOS platforms.
Specifications:
CPU
8
RAM
16.0 GB
Net
12000 Mbps
{
"configuration": {
"chart": {
"type": "scatter",
"polar": false,
"zoomType": "",
"options3d": {},
"height": null,
"width": null,
"margin": null,
"inverted": false,
"zooming": {}
},
"credits": {
"enabled": false
},
"title": {
"text": ""
},
"colorAxis": null,
"subtitle": {
"text": ""
},
"xAxis": {
"title": {
"text": [
"Single Score"
],
"useHTML": false,
"style": {
"color": "#666666"
}
},
"categories": null,
"lineWidth": 1,
"tickInterval": null,
"tickWidth": 1,
"tickLength": 10,
"tickPixelInterval": 100,
"plotLines": null,
"labels": {
"enabled": true,
"format": null,
"formatter": "",
"style": {
"color": "#666666",
"cursor": "default",
"fontSize": "11px"
},
"useHTML": false,
"step": 0
},
"plotBands": null,
"visible": true,
"floor": null,
"ceiling": null,
"type": "linear",
"min": 0,
"gridLineWidth": 1,
"gridLineColor": "#e6e6e6",
"minorTickInterval": null,
"minorTickWidth": 0,
"minTickInterval": null,
"startOnTick": true,
"endOnTick": true,
"tickmarkPlacement": 100,
"units": 100,
"minRange": 100
},
"yAxis": {
"title": {
"text": [
"Multi Score"
],
"useHTML": false,
"style": {
"color": "#666666"
}
},
"categories": null,
"plotLines": null,
"plotBands": null,
"lineWidth": null,
"tickInterval": null,
"tickLength": 10,
"floor": null,
"ceiling": null,
"gridLineInterpolation": null,
"gridLineWidth": 1,
"gridLineColor": "#e6e6e6",
"min": 0,
"max": null,
"minorTickInterval": null,
"minorTickWidth": 0,
"minTickInterval": null,
"startOnTick": true,
"endOnTick": true,
"minRange": null,
"type": "linear",
"tickmarkPlacement": null,
"labels": {
"enabled": true,
"formatter": null,
"style": {
"color": "#666666",
"cursor": "default",
"fontSize": "11px"
},
"useHTML": false
}
},
"zAxis": {
"title": {
"text": "Multi Score"
}
},
"plotOptions": {
"series": {
"dataLabels": {
"enabled": false,
"format": null,
"distance": 30,
"align": "center",
"inside": null,
"allowOverlap": false,
"style": {
"fontSize": "11px"
}
},
"showInLegend": null,
"turboThreshold": 0,
"stacking": "",
"groupPadding": 0.2,
"centerInCategory": false,
"findNearestPointBy": "x"
}
},
"navigator": {
"enabled": false
},
"scrollbar": {
"enabled": false
},
"rangeSelector": {
"enabled": false,
"inputEnabled": false
},
"legend": {
"enabled": null,
"maxHeight": null,
"align": "center",
"verticalAlign": "bottom",
"layout": "horizontal",
"width": null,
"margin": 12,
"reversed": false
},
"series": [
{
"name": "c7i.2xlarge by Amazon Web Services",
"color": "#f7981d",
"data": [
{
"x": 1409.5383068138526,
"y": 6572.0676210832025
},
{
"x": 1325.9907654741905,
"y": 6244.567258064626
},
{
"x": 1400.065345135055,
"y": 6542.804185726702
},
{
"x": 1299.1067566558374,
"y": 6101.430928287196
},
{
"x": 1410.7618827871106,
"y": 6562.782385813104
},
{
"x": 1297.7407401951068,
"y": 6237.72580170699
},
{
"x": 1482.9788550564103,
"y": 6885.549126738753
},
{
"x": 1500.3231561630043,
"y": 6903.0779018882995
},
{
"x": 1488.2743184454043,
"y": 6886.520382909593
},
{
"x": 1475.842567678689,
"y": 6793.318748086822
},
{
"x": 1495.1263779389217,
"y": 6898.489425129745
},
{
"x": 1434.8502545358522,
"y": 6726.95606339473
},
{
"x": 1346.2672315262575,
"y": 6264.424796533239
},
{
"x": 1330.3632278571733,
"y": 6107.775636401463
},
{
"x": 1416.0096987327156,
"y": 6641.782025124112
},
{
"x": 1333.3399753959247,
"y": 6311.251653311916
},
{
"x": 1327.3138608870097,
"y": 6248.28386240506
},
{
"x": 1320.5344534216442,
"y": 6143.0961959609685
},
{
"x": 1420.1395177807603,
"y": 6604.532965448267
},
{
"x": 1328.503380548404,
"y": 6288.0823316710375
},
{
"x": 1344.6002660801091,
"y": 6263.154236560463
},
{
"x": 1332.272826908722,
"y": 6205.03659544333
},
{
"x": 1420.5634215106888,
"y": 6654.451540916975
},
{
"x": 1306.817718402882,
"y": 6162.758581839719
},
{
"x": 1372.4919726366886,
"y": 6539.9298293935935
},
{
"x": 1268.4969529020145,
"y": 5908.525609014134
},
{
"x": 1376.0999946072297,
"y": 6548.667878680422
},
{
"x": 1268.5268804406296,
"y": 5943.864103313513
},
{
"x": 1379.3441288748977,
"y": 6563.615004535572
},
{
"x": 1266.068648443643,
"y": 5967.814729790027
},
{
"x": 1435.1727404835033,
"y": 6601.082295725202
},
{
"x": 1346.1766282041876,
"y": 6399.204431992626
},
{
"x": 1394.3019487045237,
"y": 6555.7969382765605
},
{
"x": 1349.9727606748477,
"y": 6390.574515370421
},
{
"x": 1367.959355451203,
"y": 6551.048582180167
},
{
"x": 1350.4688368515158,
"y": 6283.188116864429
},
{
"x": 1426.8316429204006,
"y": 6679.172419200711
},
{
"x": 1429.3850377980111,
"y": 6687.134093418687
},
{
"x": 1434.9210670957975,
"y": 6694.014122987004
},
{
"x": 1449.4040284503008,
"y": 6747.457141425959
},
{
"x": 1464.089341786371,
"y": 6618.476763129324
},
{
"x": 1405.4407147680054,
"y": 6684.017859398302
},
{
"x": 1408.514063761566,
"y": 6591.948596157865
},
{
"x": 1479.8204166258784,
"y": 6828.129930583604
},
{
"x": 1424.1112608300614,
"y": 6729.729475999194
},
{
"x": 1496.4774301653224,
"y": 6874.950527850839
},
{
"x": 1358.836506149499,
"y": 6110.720497128122
},
{
"x": 1467.701130332999,
"y": 6863.36973676424
},
{
"x": 1358.53221270173,
"y": 6091.092503905651
},
{
"x": 1484.0121293224083,
"y": 6923.087484979851
},
{
"x": 1357.992383047193,
"y": 6092.411482020575
},
{
"x": 1420.9953810963784,
"y": 6615.909613996417
},
{
"x": 1183.1215850694948,
"y": 5676.275897539096
},
{
"x": 1436.8633398269171,
"y": 6654.767135918848
},
{
"x": 1186.378869037735,
"y": 5642.15435033931
},
{
"x": 1419.6005053140402,
"y": 6695.306668994748
},
{
"x": 1187.152848611199,
"y": 5625.246202680729
},
{
"x": 1503.981306104931,
"y": 6940.339631415863
},
{
"x": 1307.6272912016257,
"y": 6290.6389210771285
},
{
"x": 1499.467977755295,
"y": 6906.216964659371
},
{
"x": 1426.155026665013,
"y": 6722.358204009006
},
{
"x": 1503.3095714991346,
"y": 6895.988675969755
},
{
"x": 1431.0879755626488,
"y": 6713.3832968793195
},
{
"x": 1276.347698488085,
"y": 5995.863133710382
},
{
"x": 1185.3677149982093,
"y": 5674.897504023616
},
{
"x": 1275.1633796036647,
"y": 5990.073119410006
},
{
"x": 1185.0348863690756,
"y": 5662.865058785537
},
{
"x": 1270.3959419520359,
"y": 5931.9390897080575
},
{
"x": 1180.3767269098473,
"y": 5676.702080747367
},
{
"x": 1344.4536574108777,
"y": 6378.5601907740565
},
{
"x": 1338.0225471973545,
"y": 6327.433623125302
},
{
"x": 1374.3006180242435,
"y": 6583.078379399085
},
{
"x": 1337.1971741458096,
"y": 6380.640875787214
},
{
"x": 1384.0114631337474,
"y": 6612.45360792537
},
{
"x": 1335.7849538013534,
"y": 6385.606932326486
},
{
"x": 1393.9813236836749,
"y": 6674.439071190938
},
{
"x": 1395.629047998663,
"y": 6641.176262470246
},
{
"x": 1411.6471548829825,
"y": 6634.689995034718
},
{
"x": 1398.9830047796054,
"y": 6644.3548435568555
},
{
"x": 1407.1674916046595,
"y": 6651.070823087282
},
{
"x": 1393.2788288170702,
"y": 6588.698158935293
},
{
"x": 1422.094385492094,
"y": 6823.422439992085
},
{
"x": 1411.4845649018175,
"y": 6513.689943212035
},
{
"x": 1486.7685496138536,
"y": 6853.390092002597
},
{
"x": 1404.7729972241448,
"y": 6491.319711365419
},
{
"x": 1485.0225980035402,
"y": 6869.237524606357
},
{
"x": 1407.0282681236592,
"y": 6495.807818126165
}
]
}
],
"drilldown": {},
"tooltip": {
"enabled": true,
"useHTML": false,
"format": null,
"headerFormat": "",
"pointFormat": "<span style=\"color:{series.color}\">Single</span>: <b>{point.x:.0f}</b><br><span style=\"color:{series.color}\">Multi</span>: <b>{point.y:.0f}</b>",
"footerFormat": "",
"shared": false,
"outside": false,
"valueDecimals": null,
"split": false
},
"annotations": null
},
"hc_type": "chart",
"id": "50855624293357028474543668406546702427"
}
| Single | Multi | |
|---|---|---|
| Max | 1504 | 6940 |
| Average | 1378 | 6455 |
| Deviation | 81.61 | 345.99 |
| Min | 1180 | 5625 |
Sign up as Freemium to get more insight.