c4.4xlarge by Amazon Web Services
Geekbench is a cross-platform processor benchmark with a scoring system that determines single-core and multi-core performance using loads simulating real-world scenarios. Geekbench 5 score is calculated with a reference score of 2500 representing the performance of the Intel Core i5-2520M @ 2.50 GHz. The software benchmark is available for Mac OS, Windows, Linux, Android and iOS platforms.
Specifications:
CPU
16
RAM
30.0 GB
{
"configuration": {
"chart": {
"type": "scatter",
"polar": false,
"zoomType": "",
"options3d": {},
"height": null,
"width": null,
"margin": null,
"inverted": false,
"zooming": {}
},
"credits": {
"enabled": false
},
"title": {
"text": ""
},
"colorAxis": null,
"subtitle": {
"text": ""
},
"xAxis": {
"title": {
"text": [
"Single Score"
],
"useHTML": false,
"style": {
"color": "#666666"
}
},
"categories": null,
"lineWidth": 1,
"tickInterval": null,
"tickWidth": 1,
"tickLength": 10,
"tickPixelInterval": 100,
"plotLines": null,
"labels": {
"enabled": true,
"format": null,
"formatter": "",
"style": {
"color": "#666666",
"cursor": "default",
"fontSize": "11px"
},
"useHTML": false,
"step": 0
},
"plotBands": null,
"visible": true,
"floor": null,
"ceiling": null,
"type": "linear",
"min": 0,
"gridLineWidth": 1,
"gridLineColor": "#e6e6e6",
"minorTickInterval": null,
"minorTickWidth": 0,
"minTickInterval": null,
"startOnTick": true,
"endOnTick": true,
"tickmarkPlacement": 100,
"units": 100,
"minRange": 100
},
"yAxis": {
"title": {
"text": [
"Multi Score"
],
"useHTML": false,
"style": {
"color": "#666666"
}
},
"categories": null,
"plotLines": null,
"plotBands": null,
"lineWidth": null,
"tickInterval": null,
"tickLength": 10,
"floor": null,
"ceiling": null,
"gridLineInterpolation": null,
"gridLineWidth": 1,
"gridLineColor": "#e6e6e6",
"min": 0,
"max": null,
"minorTickInterval": null,
"minorTickWidth": 0,
"minTickInterval": null,
"startOnTick": true,
"endOnTick": true,
"minRange": null,
"type": "linear",
"tickmarkPlacement": null,
"labels": {
"enabled": true,
"formatter": null,
"style": {
"color": "#666666",
"cursor": "default",
"fontSize": "11px"
},
"useHTML": false
}
},
"zAxis": {
"title": {
"text": "Multi Score"
}
},
"plotOptions": {
"series": {
"dataLabels": {
"enabled": false,
"format": null,
"distance": 30,
"align": "center",
"inside": null,
"allowOverlap": false,
"style": {
"fontSize": "11px"
}
},
"showInLegend": null,
"turboThreshold": 0,
"stacking": "",
"groupPadding": 0.2,
"centerInCategory": false,
"findNearestPointBy": "x"
}
},
"navigator": {
"enabled": false
},
"scrollbar": {
"enabled": false
},
"rangeSelector": {
"enabled": false,
"inputEnabled": false
},
"legend": {
"enabled": null,
"maxHeight": null,
"align": "center",
"verticalAlign": "bottom",
"layout": "horizontal",
"width": null,
"margin": 12,
"reversed": false
},
"series": [
{
"name": "c4.4xlarge by Amazon Web Services",
"color": "#f7981d",
"data": [
{
"x": 860.4490969928345,
"y": 6952.865078028713
},
{
"x": 858.2071153023833,
"y": 6942.230700795187
},
{
"x": 860.503336061677,
"y": 6921.891591550209
},
{
"x": 858.3487184976941,
"y": 6940.33718883736
},
{
"x": 861.025615825843,
"y": 6931.239157791642
},
{
"x": 854.512327749512,
"y": 6935.255982992276
},
{
"x": 858.8875071929338,
"y": 6919.8060709878255
},
{
"x": 857.1786146979482,
"y": 6942.530625663563
},
{
"x": 858.973585776281,
"y": 6944.291238907093
},
{
"x": 857.0895020852122,
"y": 6924.45834628939
},
{
"x": 858.6193229150149,
"y": 6934.249111036605
},
{
"x": 855.506762090672,
"y": 6922.094093962392
},
{
"x": 859.7153568903236,
"y": 6928.8268418703465
},
{
"x": 853.1525675177244,
"y": 6910.634648359775
},
{
"x": 852.1632908547949,
"y": 6951.110135029898
},
{
"x": 857.7560695749248,
"y": 6915.421237827917
},
{
"x": 858.4497458665141,
"y": 6910.260632221728
},
{
"x": 858.8045503076571,
"y": 6910.571448738805
},
{
"x": 856.5977088008801,
"y": 6932.865385037818
},
{
"x": 857.7758569484753,
"y": 6935.310229183009
}
]
}
],
"drilldown": {},
"tooltip": {
"enabled": true,
"useHTML": false,
"format": null,
"headerFormat": "",
"pointFormat": "<span style=\"color:{series.color}\">Single</span>: <b>{point.x:.0f}</b><br><span style=\"color:{series.color}\">Multi</span>: <b>{point.y:.0f}</b>",
"footerFormat": "",
"shared": false,
"outside": false,
"valueDecimals": null,
"split": false
},
"annotations": null
},
"hc_type": "chart",
"id": "10360807574284110530873791807572613832"
}
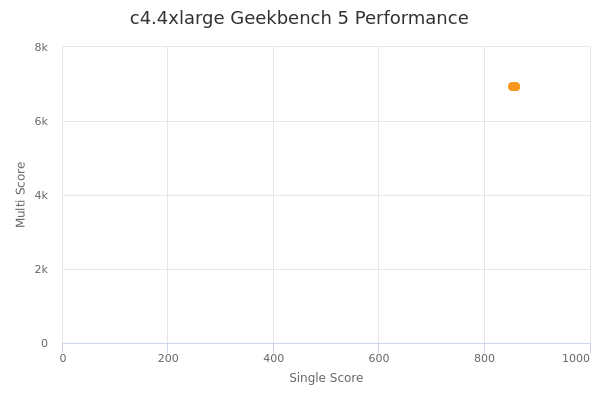
| Single | Multi | |
|---|---|---|
| Max | 861 | 6953 |
| Average | 858 | 6930 |
| Deviation | 2.29 | 12.82 |
| Min | 852 | 6910 |
Sign up as Freemium to get more insight.
- In same series
- c4.large
- c4.xlarge
- c4.2xlarge
- c4.4xlarge
- c4.8xlarge